Viewing#
hvPlot is written to work well inside a Jupyter notebook, from the interactive Python command prompt, or inside a Python batch script. In this user guide we will discover how to use hvPlot to view plots in each of these cases and how to save the plots to a separate file.
Using hvPlot in different contexts#
Notebook#
In a Jupyter notebook, hvPlot will return HoloViews objects that display themselves, as long as the plotting library has been loaded. The easiest way of loading the plotting library is to import one of the plotting accessors such as pandas’ one with hvplot.pandas:
import hvplot.pandas # noqa
The above import statement triggers the loading of the default plotting library, i.e. Bokeh.
Here we will load some of the sample data and then compose the HoloViews objects into a layout:
from hvplot.sample_data import airline_flights, us_crime

violent_crime = us_crime.hvplot(x='Year', y='Violent Crime rate', width=400)
burglaries    = us_crime.hvplot(x='Year', y='Burglary rate', width=400)

violent_crime + burglaries
Using Panel#
To display the object from inside a function it’s recommended that you use Panel. Panel can also be used to create more complicated layouts, to add additional interactivity, and to deploy servers.
import panel as pn

pane = pn.panel(violent_crime)
pane
This pane can be updated with another HoloViews object replacing the plot:
pane.object = burglaries
Or the object can be updated inplace:
pane.object *= violent_crime
Python Command Prompt & Scripts#
When working outside the notebook we can instead use the hvplot.show function, which will open the plot in a new browser window:
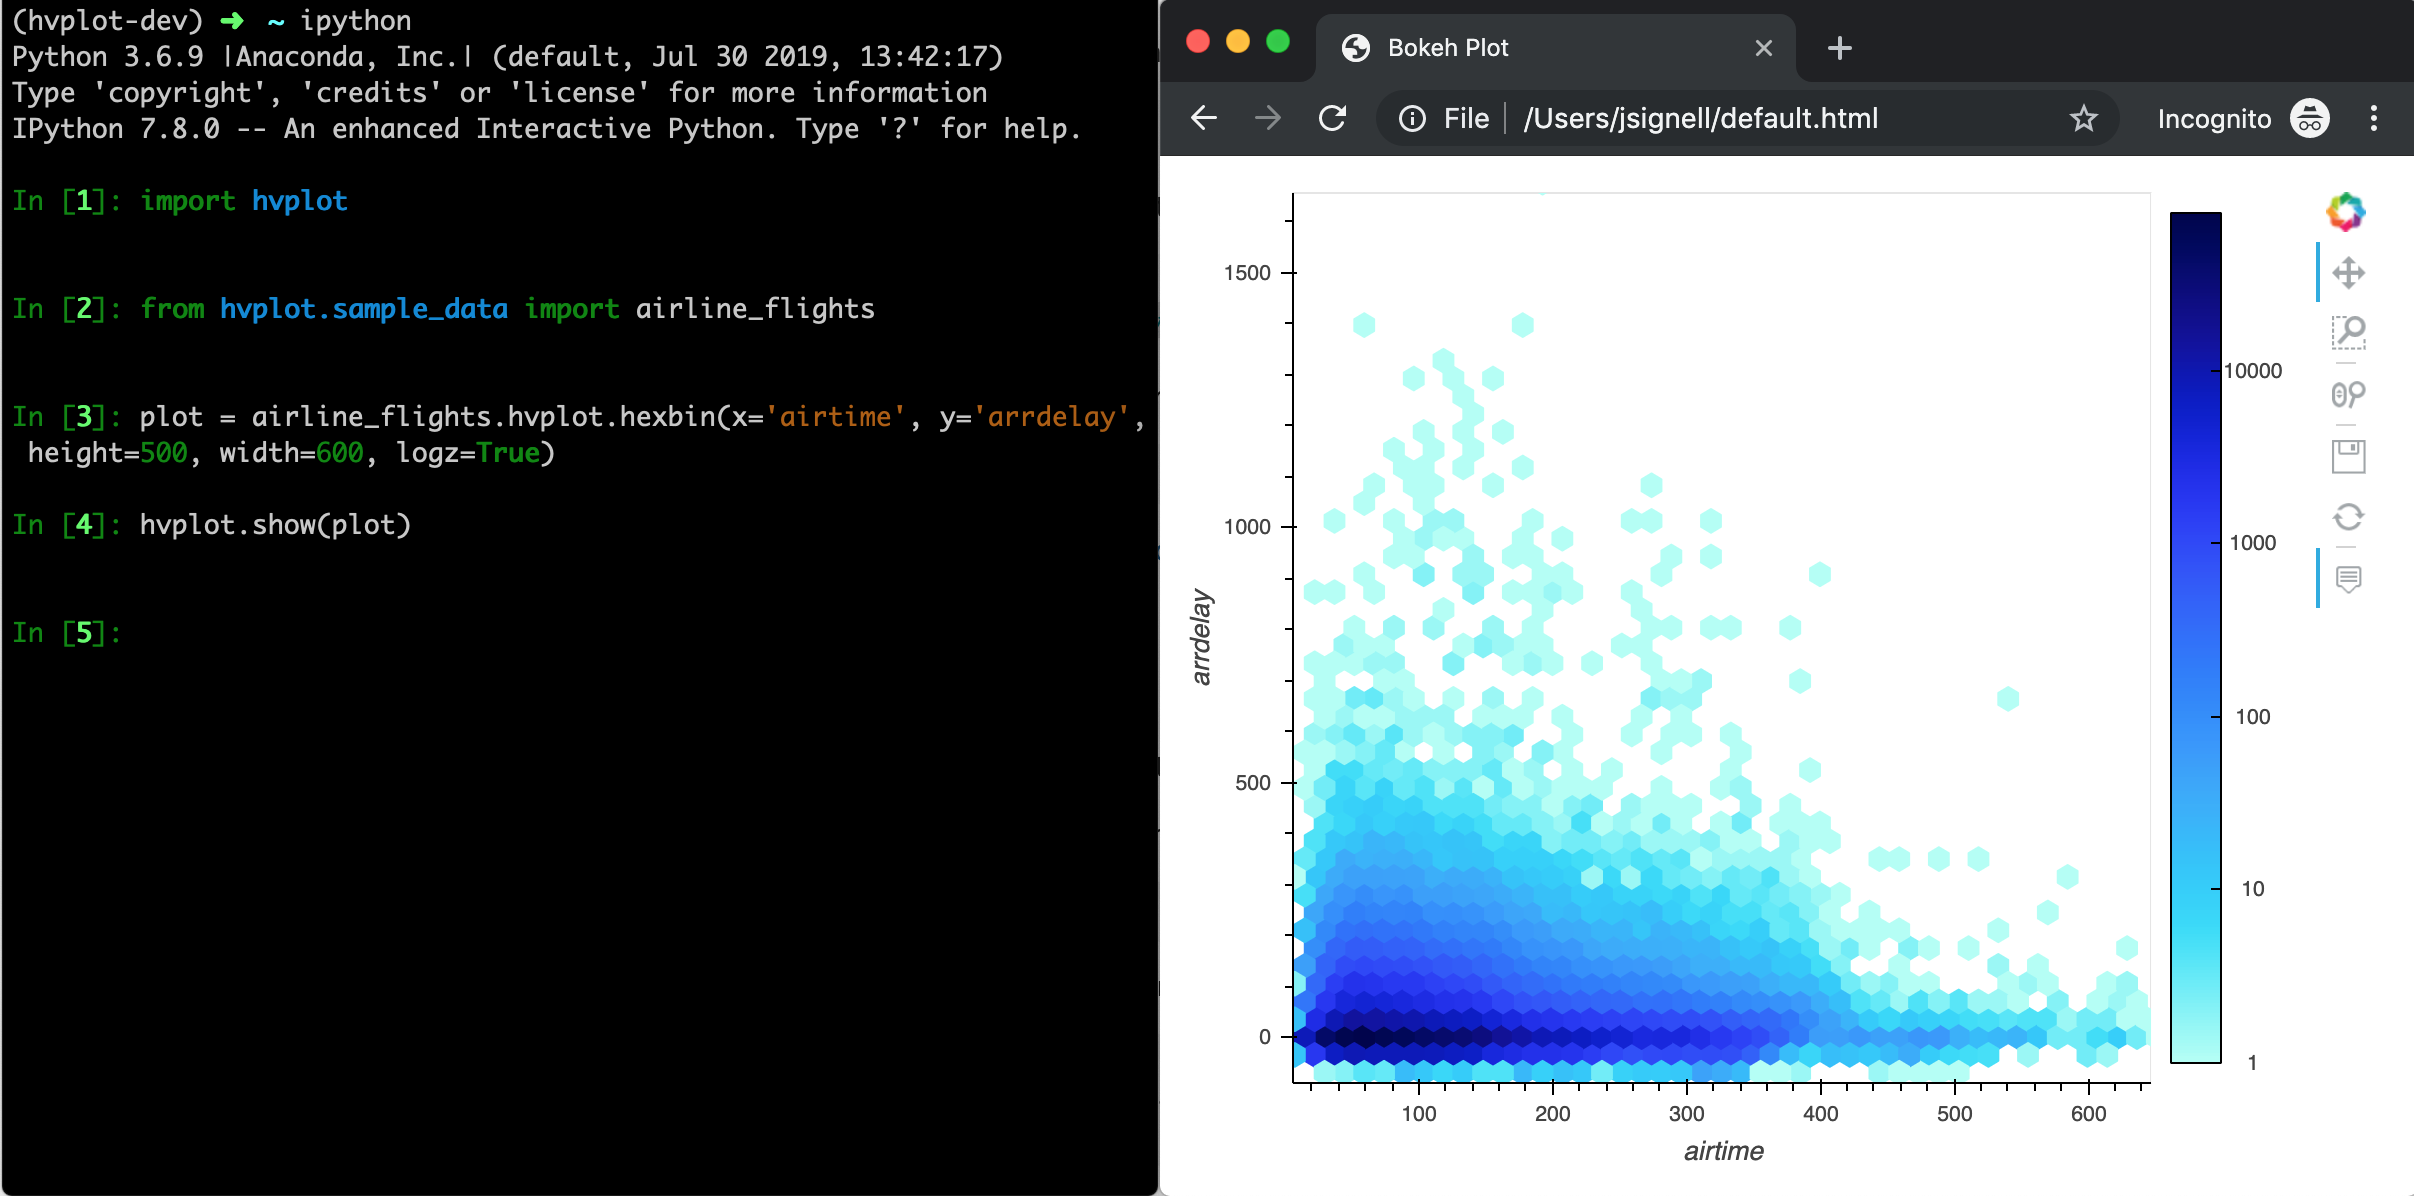
For static plots this will simply save a temporary file and open it, however for dynamic and datashaded plots it will automatically launch a Bokeh server, enabling all the dynamic features.
Saving plots#
When looking at any Bokeh plot in a web browser, you can use the toolbar’s “Save” tool to export the plot as a PNG (try it on one of the plots above!).
hvPlot also provides a convenient save function to export HoloViews objects to a file. By default it will save the plot as HTML:
plot = airline_flights.hvplot.hexbin(x='airtime', y='arrdelay', colorbar=True, width=600, height=500, logz=True)

hvplot.save(plot, 'test.html')
By default, the HTML file generated will depend on loading JavaScript code for BokehJS from the online CDN repository, to reduce the file size. If you need to work in an airgapped or no-network environment, you can declare that INLINE resources should be used instead of CDN:
from bokeh.resources import INLINE
hvplot.save(plot, 'test.html', resources=INLINE)
Finally, if a ‘png’ file extension is specified, the exported plot will be rendered as a PNG, which currently requires Selenium and PhantomJS to be installed:
hvplot.save(plot, 'test.png')