Reference Gallery#
Find the list of supported libraries on this page.
Tabular#
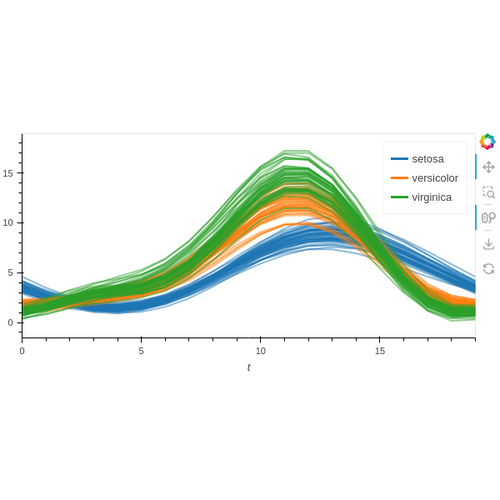
Andrewscurves
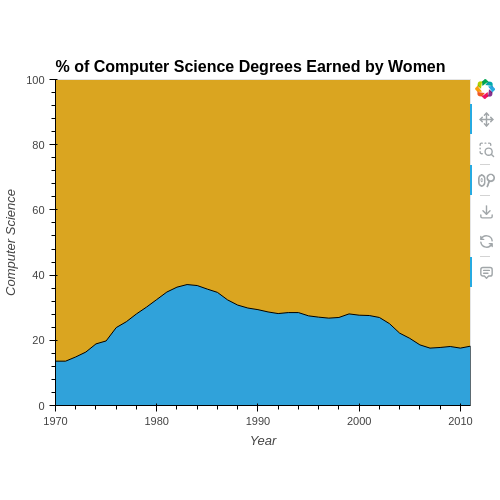
Area
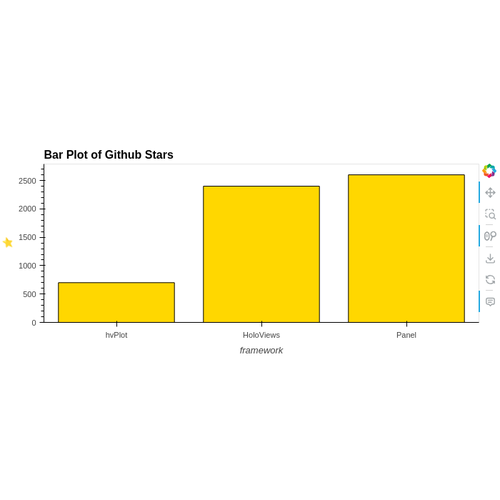
Bar
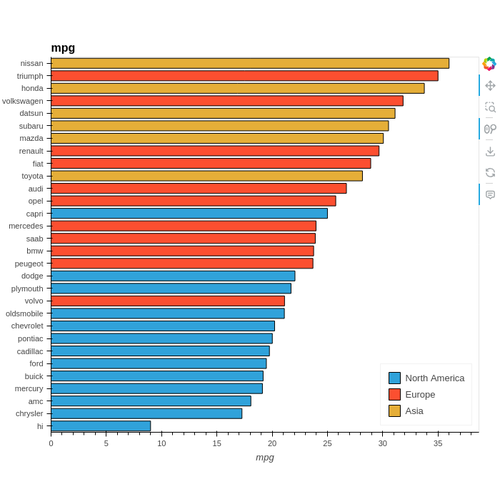
Barh
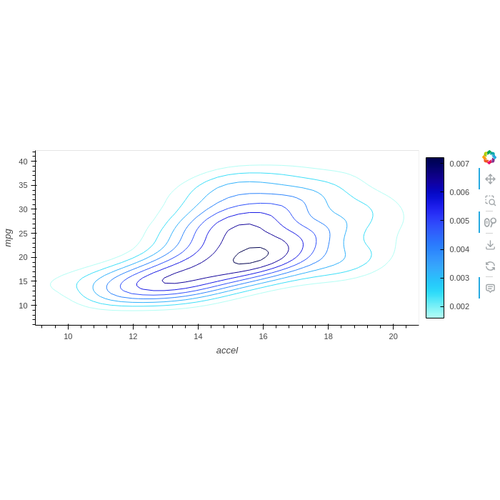
Bivariate
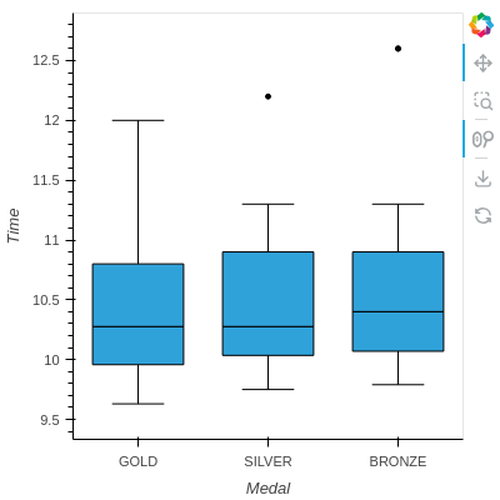
Box
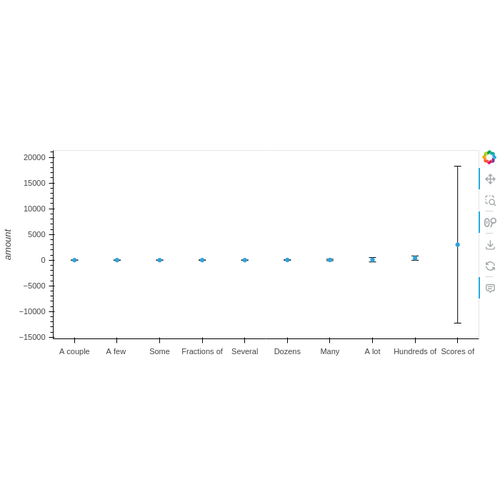
Errorbars
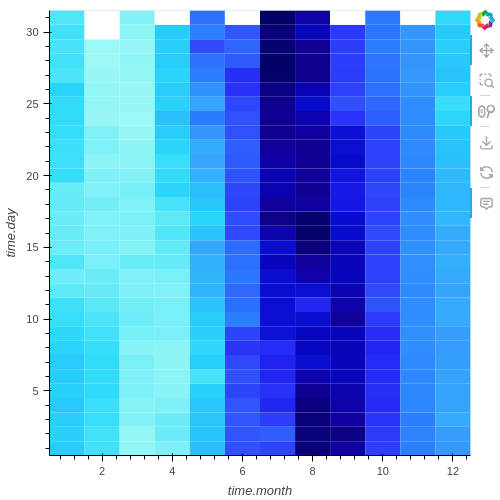
Heatmap
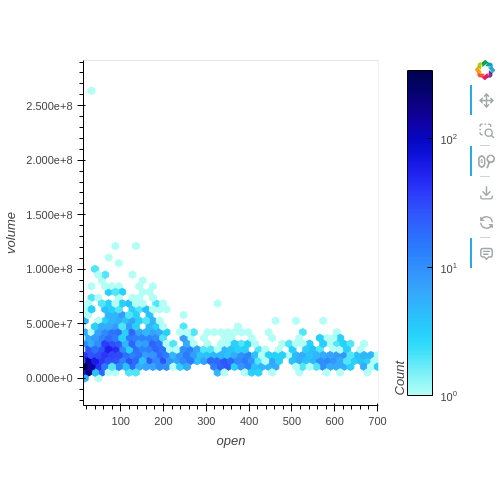
Hexbin
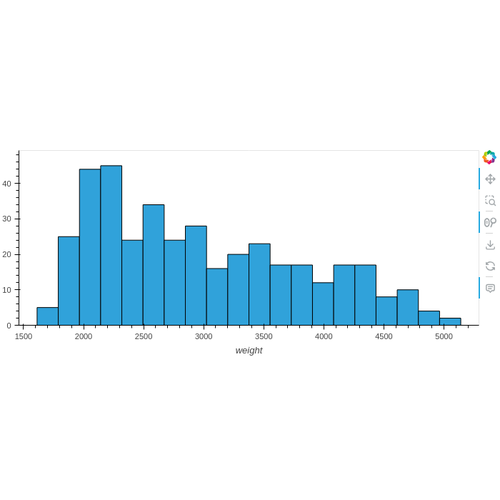
Hist
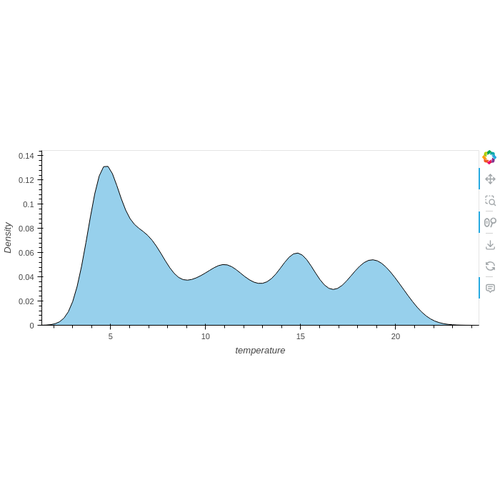
Kde
Labels
Lagplot
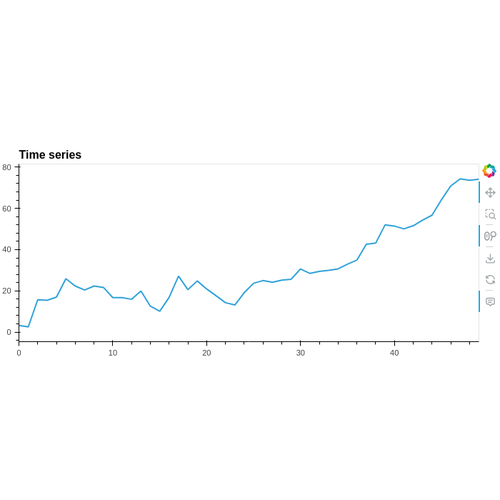
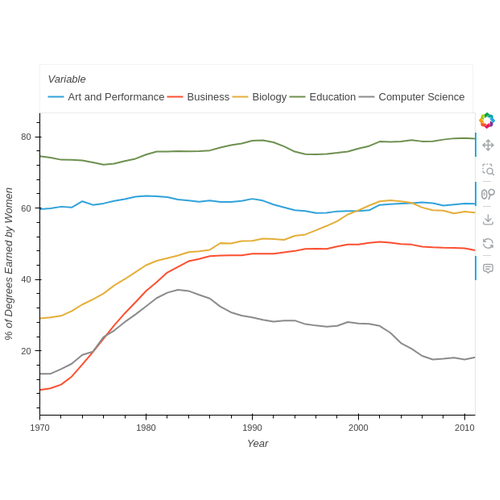
Line
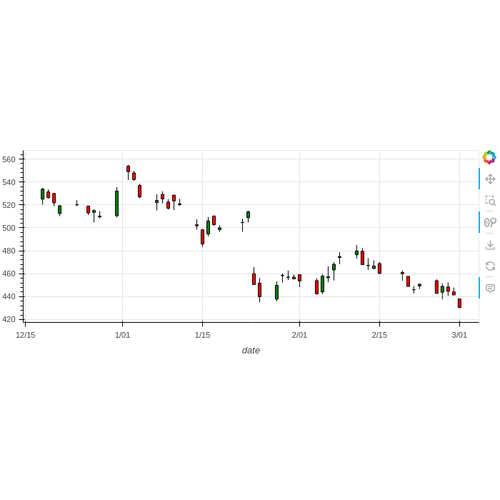
Ohlc
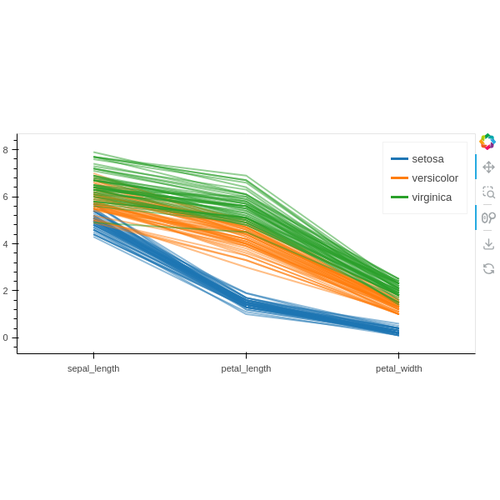
Parallelcoordinates
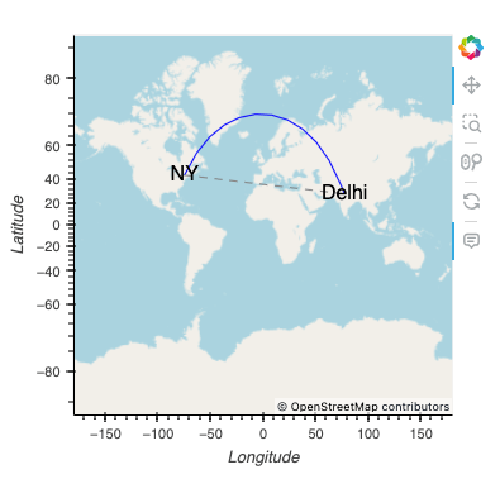
Paths
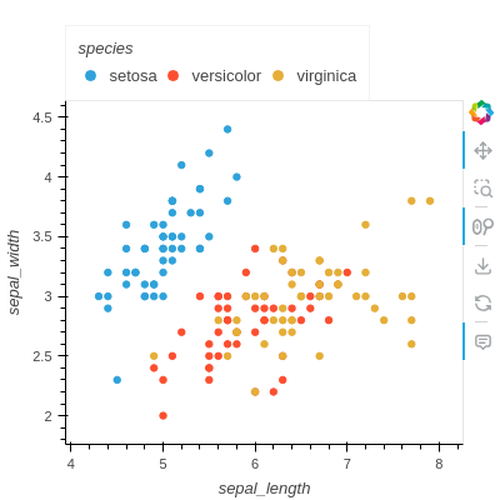
Scatter
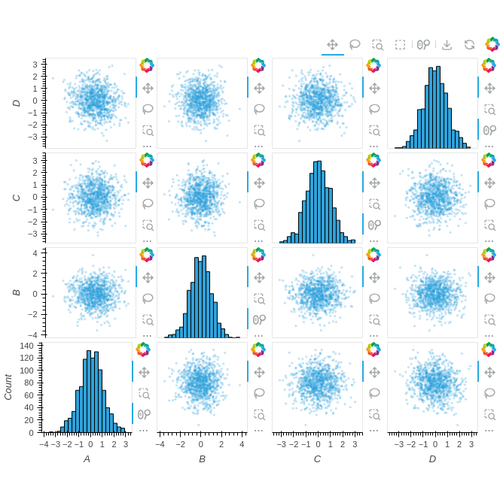
Scattermatrix
Step

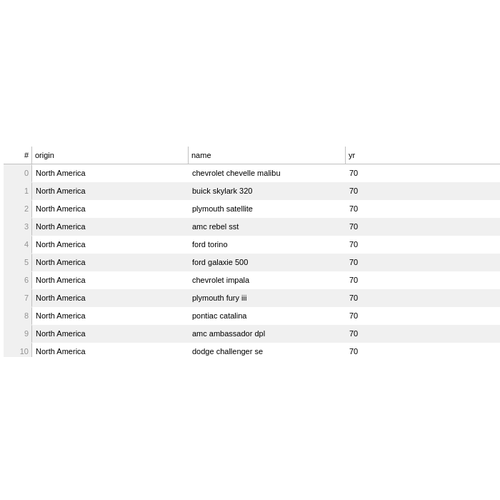
Table
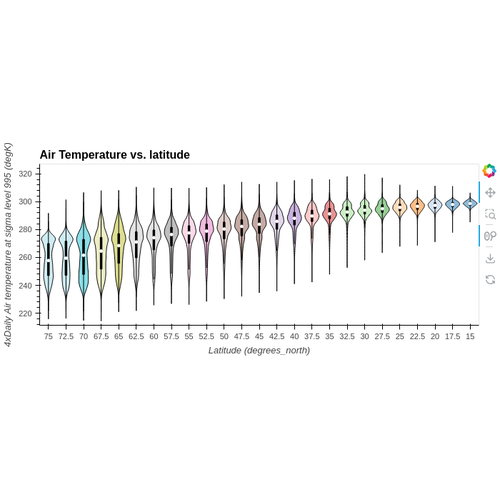
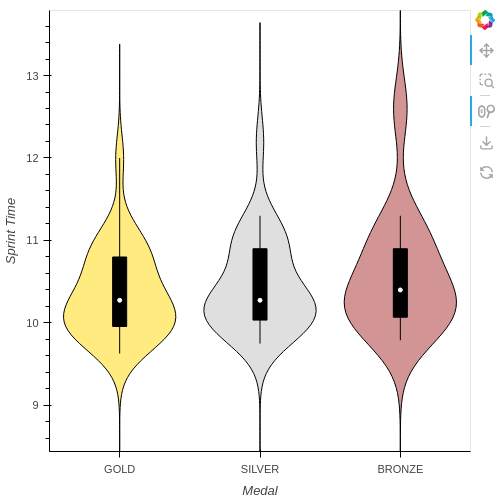
Violin
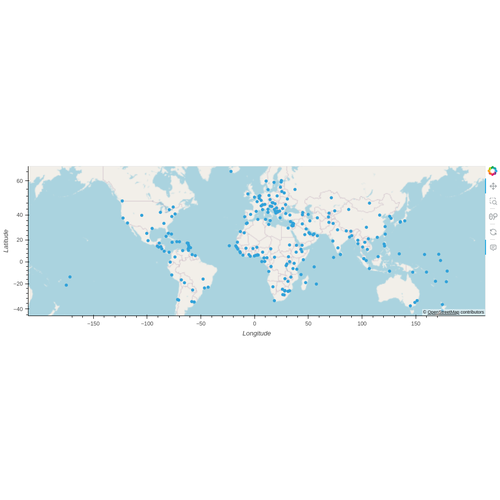
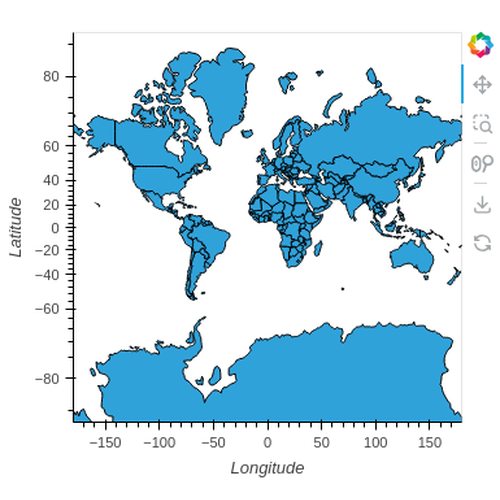
Geopandas#
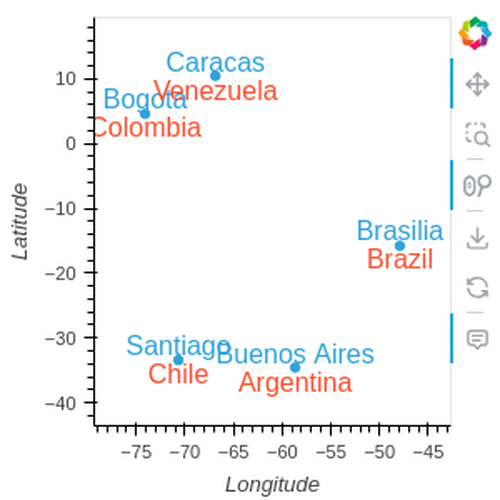
Points
Polygons
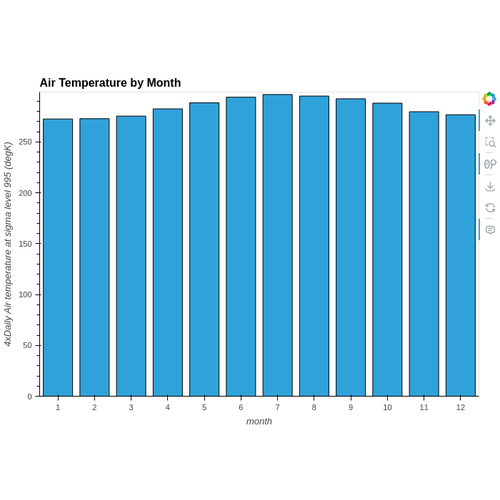
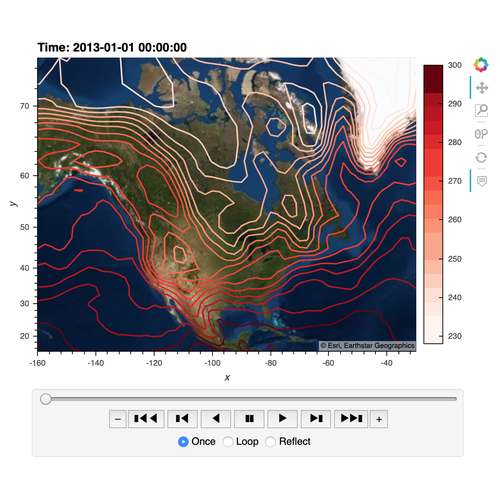
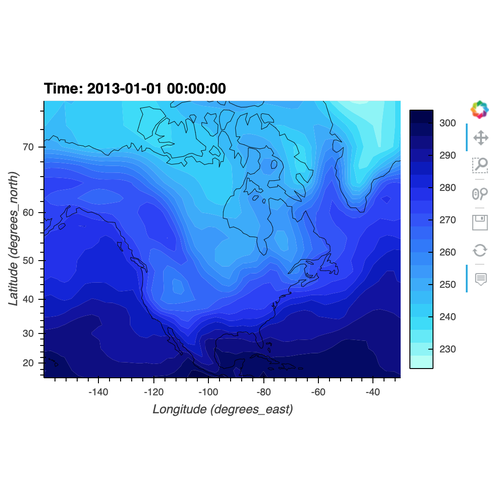
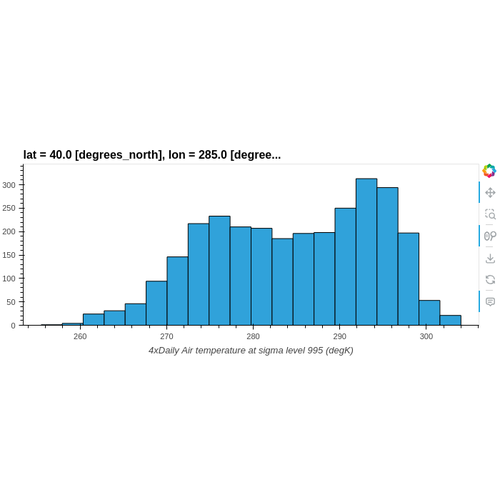
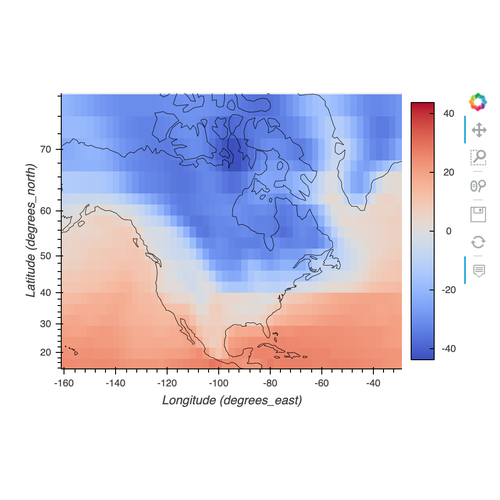
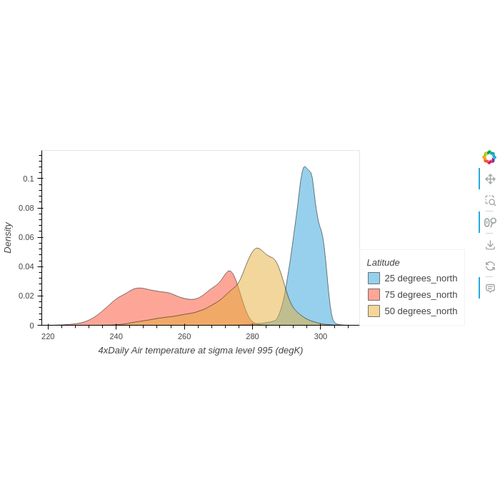
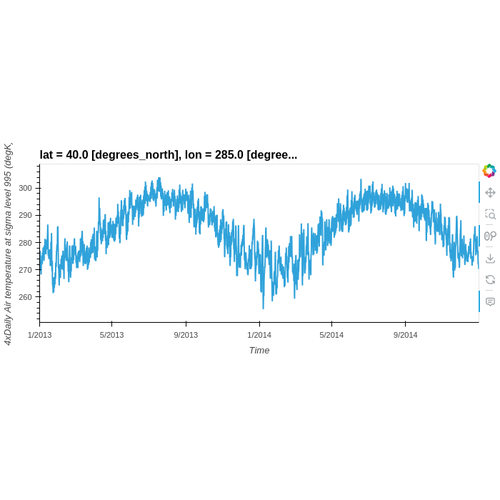
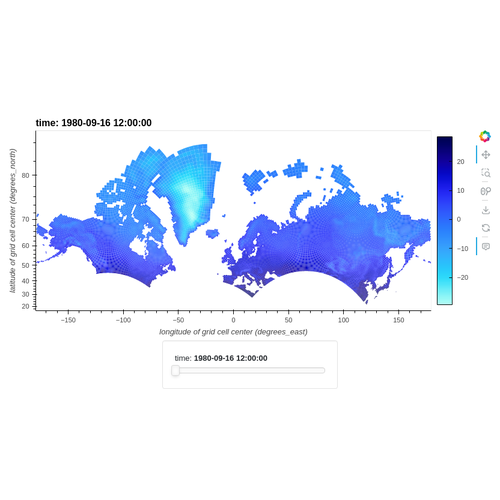
Xarray#
Bar
Contour
Contourf
Hist
Image
Kde
Line
Quadmesh
Rgb
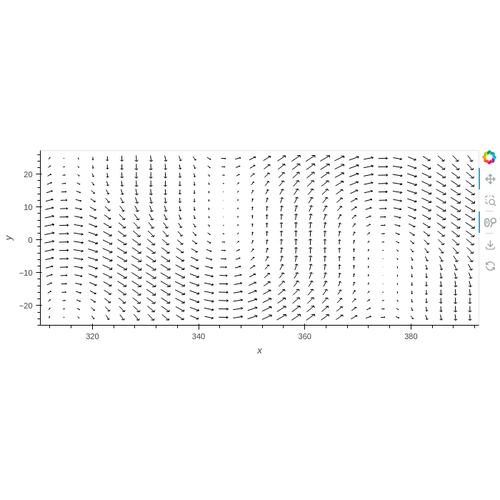
Vectorfield
Violin