Plotting Extensions#
from hvplot.sample_data import us_crime
hvPlot allows to generate plots with three different plotting extensions: Bokeh, Matplotlib and Plotly. Support for Maplotlib and Plotly was added in version 0.8.0, before which Bokeh was the only option available and is as such kept as the default plotting extension.
Loading plotting extensions#
Importing hvPlot accessors as shown throughout the documentation (e.g. import hvplot.pandas, import hvplot.xarray, …) loads by default the Bokeh plotting extension. The extension function can be used after this first import to additionally load the Matplotlib and Plotly plotting extensions, or just one of them. The currently active extension is the first one passed to extension().
import hvplot.pandas # This import automatically loads the Bokeh extension.
hvplot.extension('matplotlib', 'plotly') # This call loads the Matplotlib (the active one) and Plotly extensions.
us_crime.hvplot(x='Year', y='Violent Crime rate')

Switching the plotting extension#
The output function allows to switch the plotting extension by setting the backend parameter. It must be called after importing an accessor (e.g. import hvplot.pandas) and calling to extension:
hvplot.output(backend='plotly')
us_crime.hvplot(x='Year', y='Violent Crime rate')
extension function could also be used to switch the plotting extension. You should however prefer output as any call to extension actually internally loads code in the output of the cell where it is executed, which can significantly increase the notebook size if extension is called in multiple cells.
Plot styling options#
On top of the parameters part of .hvplot()’s API, a plot can be further customized by providing detailed styling options. By default, i.e. without calling hvplot.extension(), the accepted styling options are those of Bokeh, such as line_dash='dashed'. When another extension is set with either extension or output the styling options of that extension are expected, e.g. linestyle='dashed' for Matplotlib.
hvplot.output(backend='bokeh')
us_crime.hvplot(x='Year', y='Violent Crime rate', line_dash='dashed')
hvplot.output(backend='matplotlib')
us_crime.hvplot(x='Year', y='Violent Crime rate', linestyle='dashed')

It is also possible to generates plots with either Matplotlib or Plotly that are constructed with Bokeh options. This can be used for instance to create plots previously generated with Bokeh with another backend, without having to change any parameter. The only change required is to declare Bokeh as the compatible extension with hvplot.extension('matplotlib', compatibility='bokeh'), preferably at the beginning of the notebook.
hvplot.extension('matplotlib', compatibility='bokeh')
violent_crime = us_crime.hvplot(x='Year', y='Violent Crime rate', line_dash='dashed')
violent_crime
violent_crime.opts.info()
:Curve [Year] (Violent Crime rate)
| Options(aspect=2.3333333333333335, axiswise=False, fig_size=233.33333333333334, framewise=True,
| labelled=['x', 'y'], linestyle='dashed', linewidth=2, logx=False, logy=False,
| show_grid=False, show_legend=True)
You can see that line_dash='dashed' has been internally converted to linestyle='dashed' that is a valid option for the Matplotlib plotting extension. Note that support for all Bokeh options is currently incomplete and will continue to be improved while equivalent support for Plotly and Matplotlib is planned for a future release
Obtaining the underlying figure object#
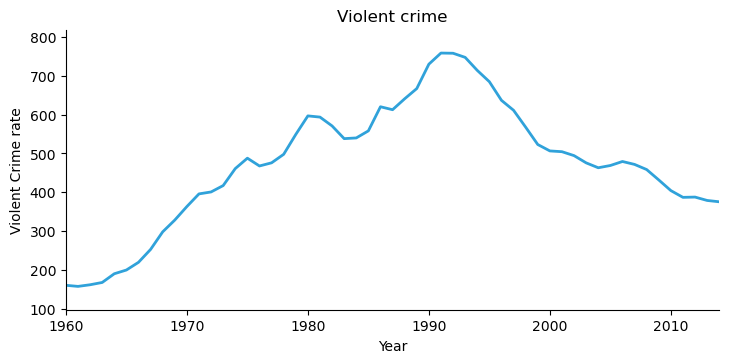
In some cases it can be convenient to construct a plot with hvPlot and then get a handle on the figure object of the underlying plotting library to further customize the plot or to embed it in some more complex application. The render function allows to get a handle on the figure object. The following examples show that it’s possible to use the API of Bokeh, Matplotlib or Plotly to update the title of the violent_crime plot.
violent_crime = us_crime.hvplot(x='Year', y='Violent Crime rate')
from bokeh.io import show
bk_fig = hvplot.render(violent_crime, backend='bokeh')
bk_fig.title = 'Violent crime'
show(bk_fig)
%matplotlib inline
mpl_fig = hvplot.render(violent_crime, backend='matplotlib')
axes = mpl_fig.get_axes()
axes[0].set_title('Violent crime')
mpl_fig
from plotly.graph_objects import Figure
plotly_fig = hvplot.render(violent_crime, backend='plotly')
fig = Figure(plotly_fig).update_layout(title='Violent crime')
fig
As demonstrated on this page hvPlot offers you the ability to choose your favorite plotting extension among those supported by HoloViews, on which hvPlot is built.