
How to Save Plots as Animated GIFs#
This guide shows how to save an hvPlot plot as an animated GIF, with one frame per value of a groupby column. Only the Matplotlib backend can write GIFs, and it needs Pillow installed.
Create an animation#
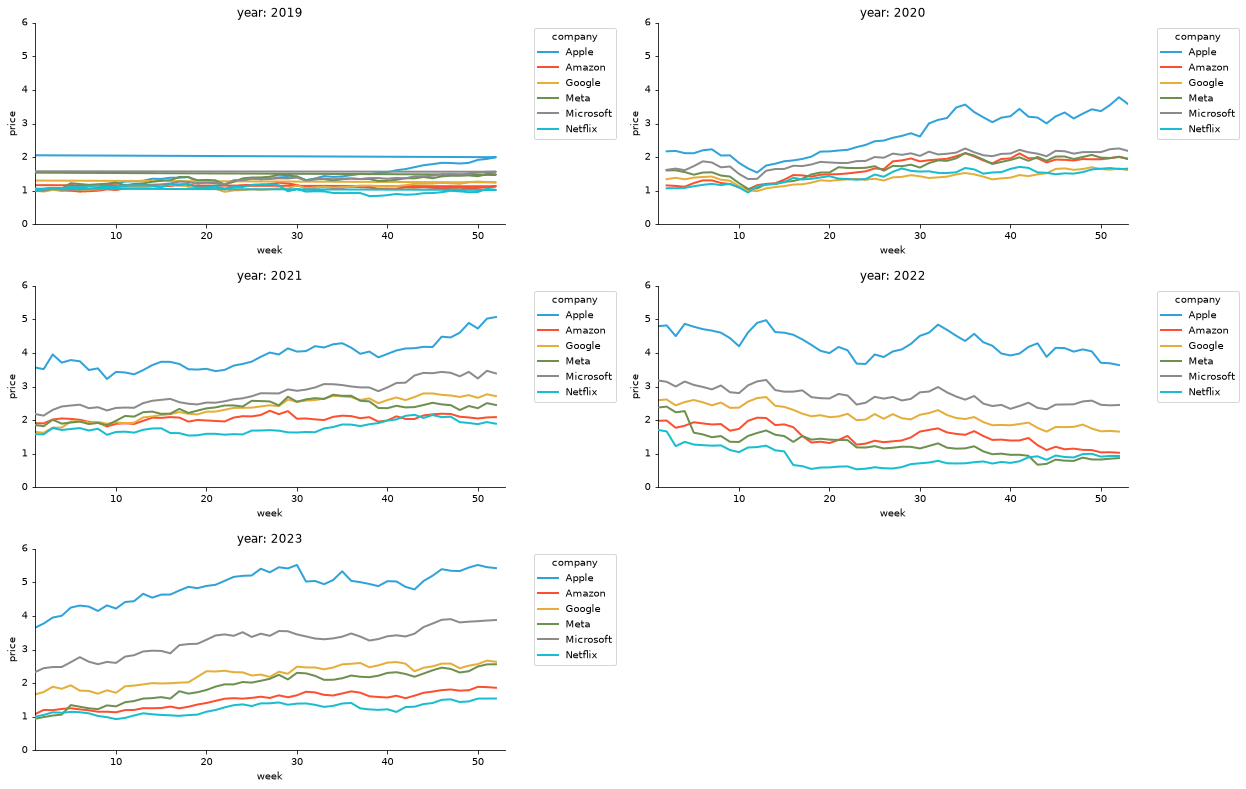
Load the Matplotlib backend and plot with groupby and dynamic=False. The result is a HoloViews HoloMap holding one frame per group, instead of a plot with a widget. Fix the axis limits with xlim and ylim so the axes do not change from frame to frame:
import hvplot.pandas  # noqa
import hvplot.xarray  # noqa

hvplot.extension('matplotlib')

stocks = hvplot.sampledata.stocks("pandas")
prices = stocks.melt("date", var_name="company", value_name="price")
prices["year"] = prices["date"].dt.year
prices["week"] = prices["date"].dt.isocalendar().week.astype(int)

plot = prices.hvplot.line(
    x="week",
    y="price",
    by="company",
    groupby="year",
    dynamic=False,
    xlim=(1, 53),
    ylim=(0, 6),
)
Save the GIF#
Save with hvplot.save, the GIF format is inferred from the .gif extension. Set fps (frames per second) explicitly to control the speed of the animation:
hvplot.save(plot, 'stocks.gif', fps=2)
from IPython.display import Image

Image('stocks.gif')
Set the size and resolution#
Scale the frames with the fig_size option (a percentage of the default size), and set their resolution with dpi. Both change the size of the GIF in pixels:
hvplot.save(plot.opts(fig_size=200), 'stocks_large.gif', fps=2, dpi=100)
Animate gridded data#
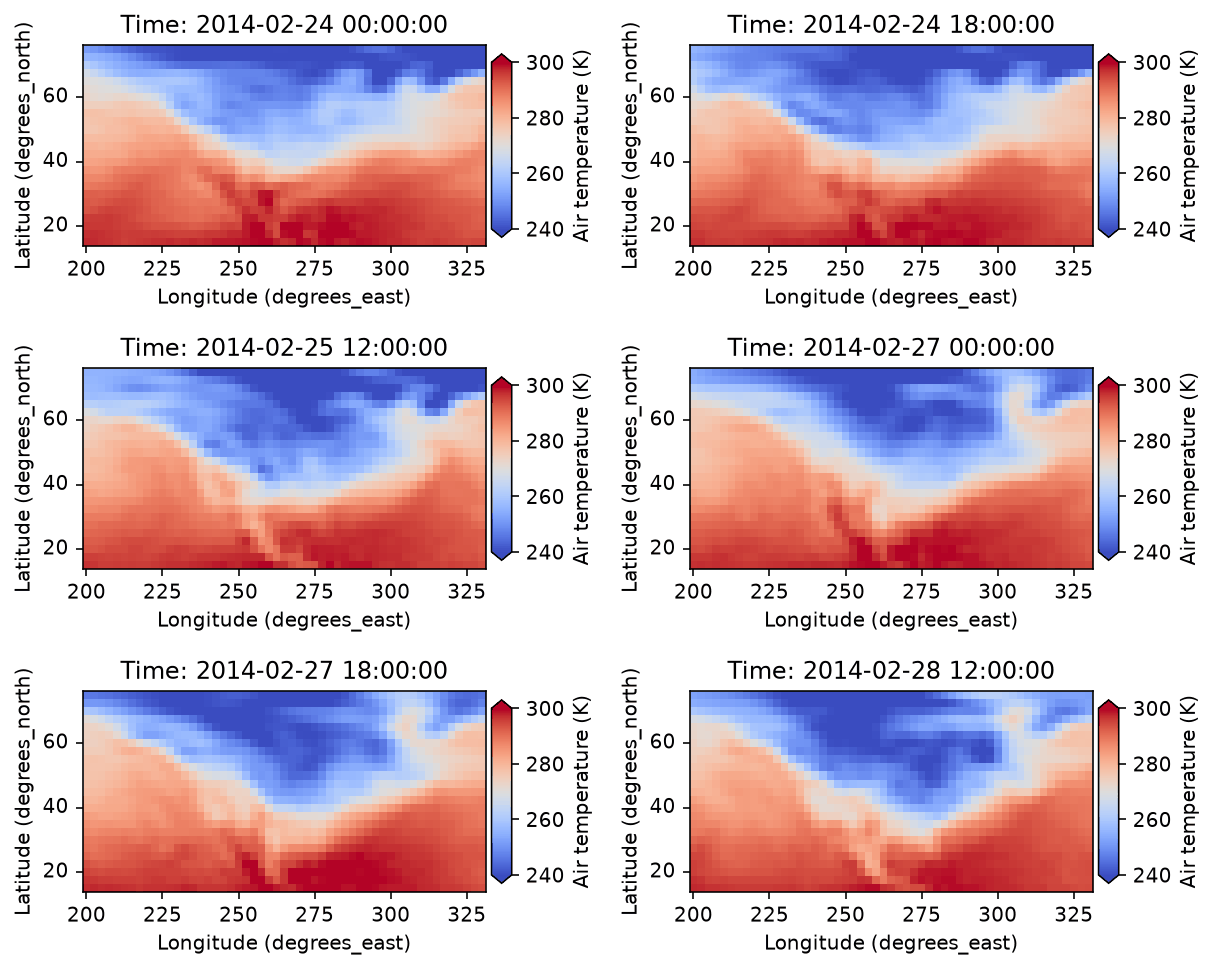
Gridded xarray data works the same way. Select a few time steps to keep the GIF small, and fix clim so the colors mean the same thing in every frame. Here groupby='time' creates one frame per time step:
air = hvplot.sampledata.air_temperature("xarray").air
air = air.isel(time=slice(0, 20, 3))

air_plot = air.hvplot.image(
    x="lon",
    y="lat",
    groupby="time",
    dynamic=False,
    clim=(240, 300),
    cmap="coolwarm",
    clabel="Air temperature (K)",
    aspect=2,
)
hvplot.save(air_plot, "air_temperature.gif", fps=2, dpi=144)
Image('air_temperature.gif')
See also
The HoloViews Exporting and Archiving user guide for more export options.
How to Save Matplotlib Plots to save static images.
See also
Display plots in notebooks, scripts and apps