Gallery#
Explore a curated set of example visualizations using hvPlot with different backends and datasets. For more examples using hvPlot and other HoloViz tools to solve real world problems, see the HoloViz Examples website.
Basic Charts#
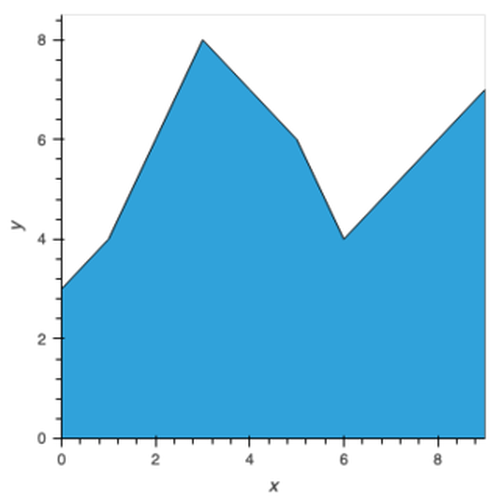
Simple Area Chart
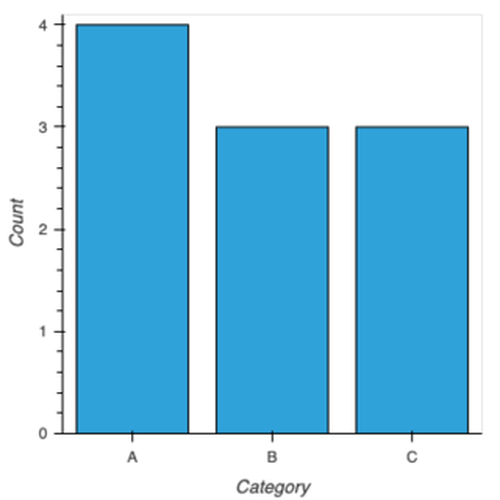
Simple Bar Chart
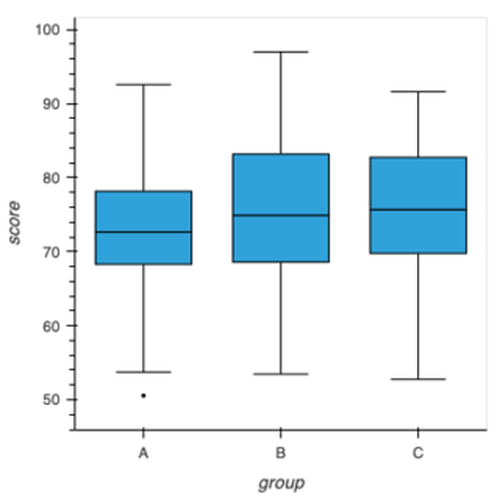
Simple Box Plot
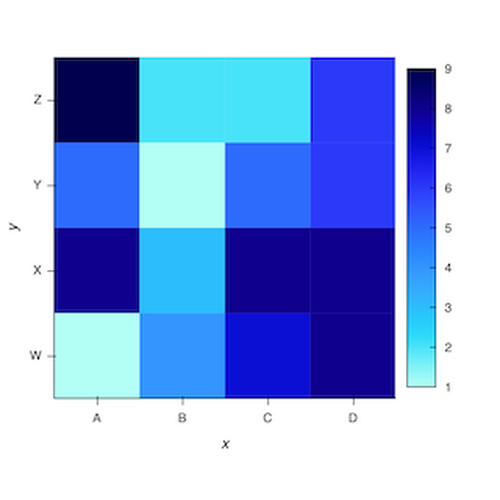
Simple Heatmap
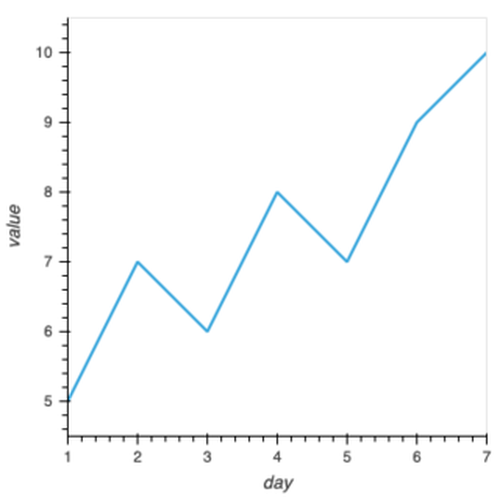
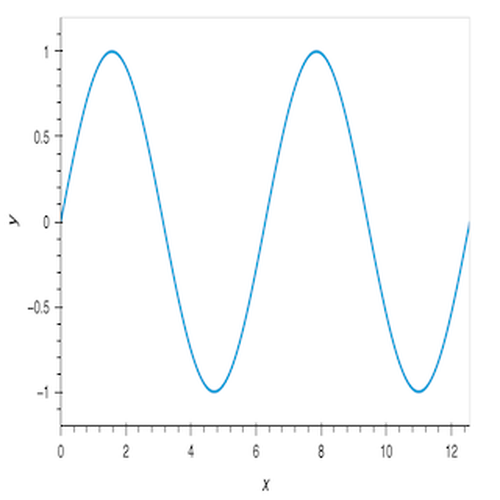
Simple Line Plot
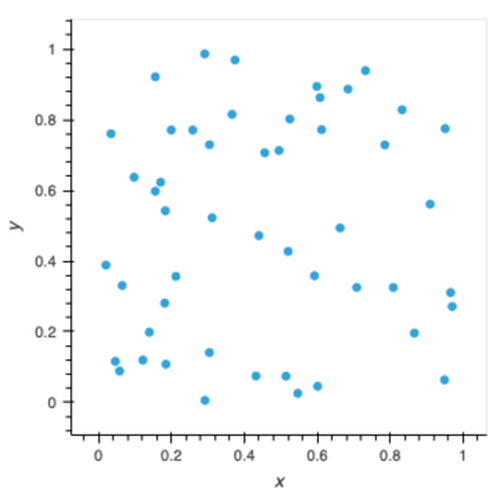
Simple Scatter Plot
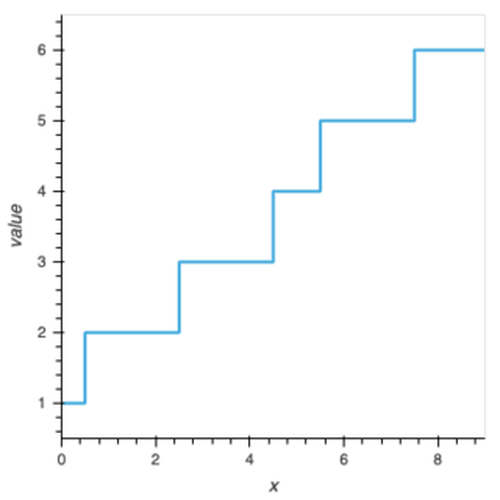
Simple Step Chart
Categorical#
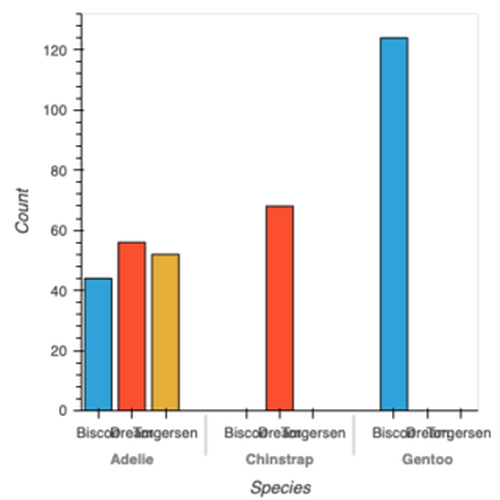
Category Breakdown Bar Chart
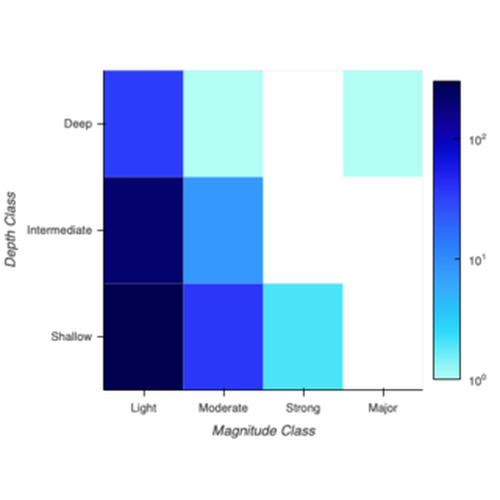
Category Heatmap
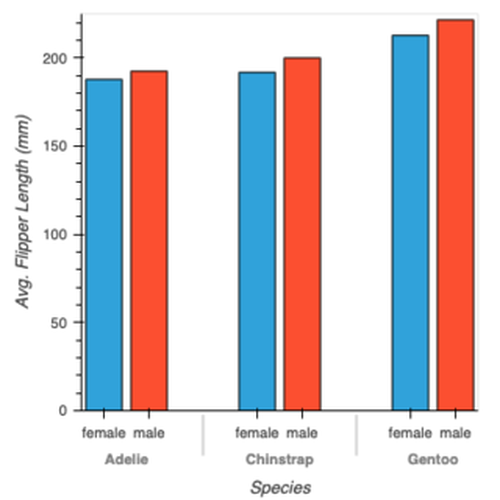
Grouped Bar Chart
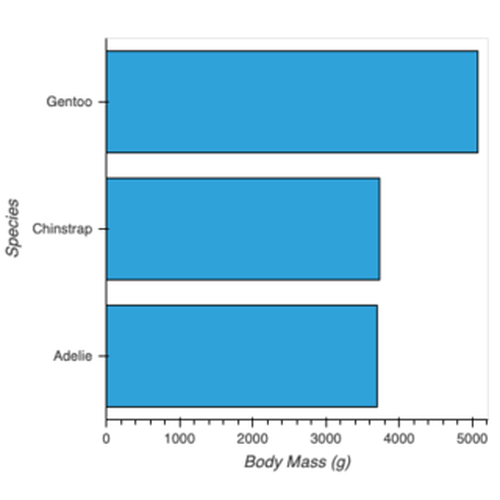
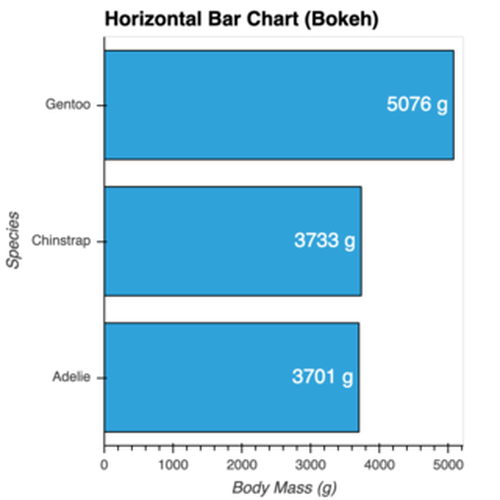
Horizontal Bar Chart
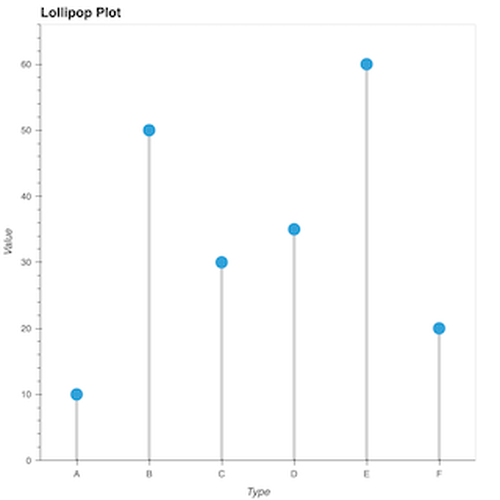
Lollipop Plot
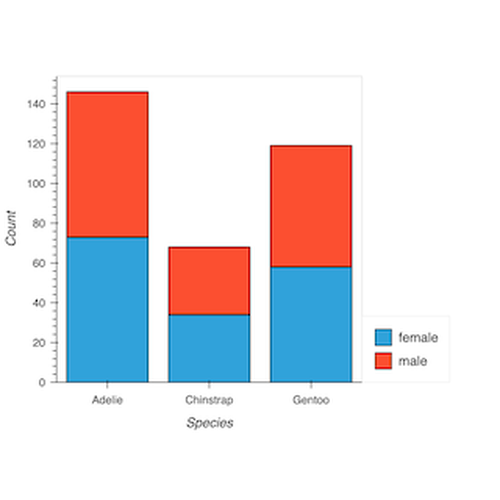
Stacked Bar Chart
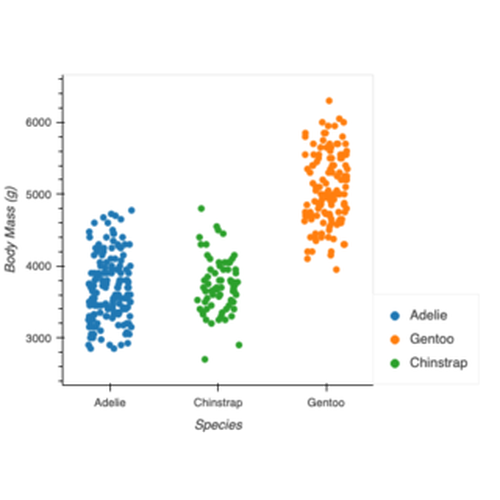
Jittered Strip Plot
Multidimensional#
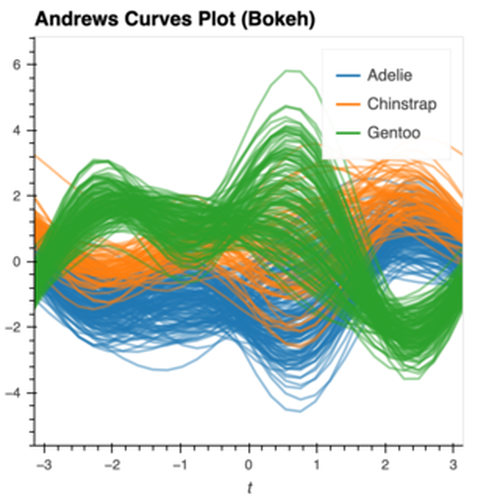
Andrews Curves Plot
Faceted Time Series using Groupby
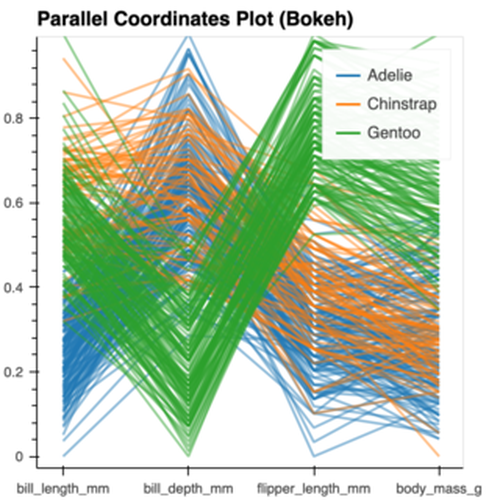
Parallel Coordinates Plot
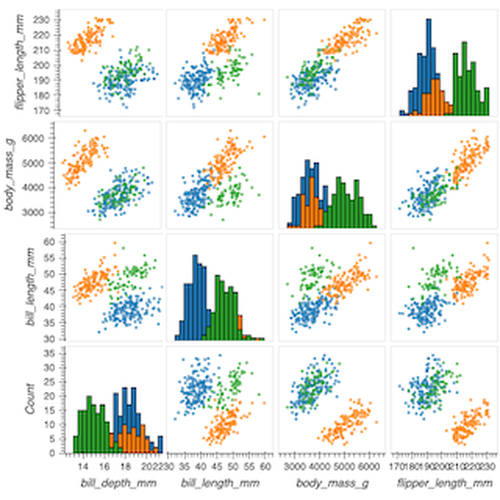
Scatter Matrix Plot
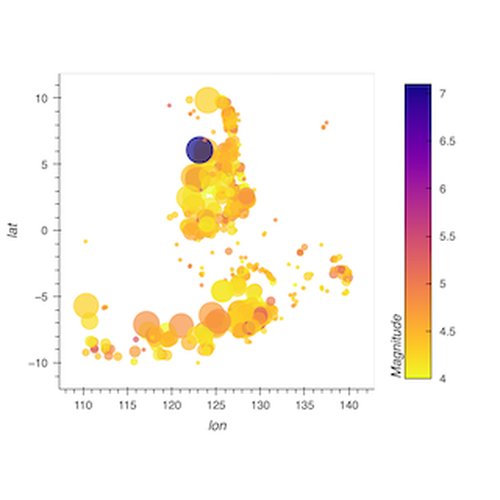
Scatter with Color and Size Encoding
Statistical#
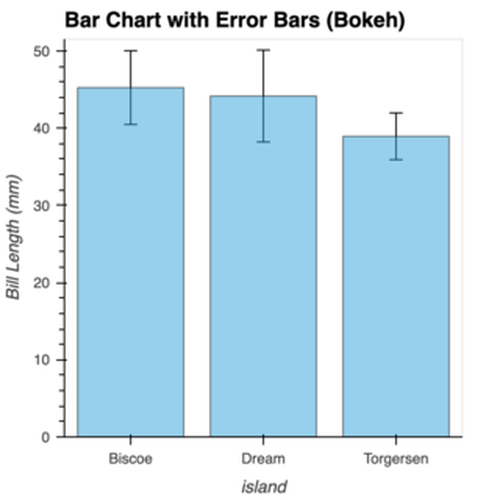
Bar Chart with Error Bars
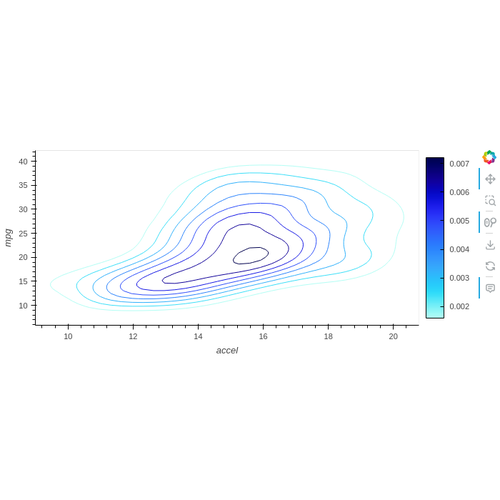
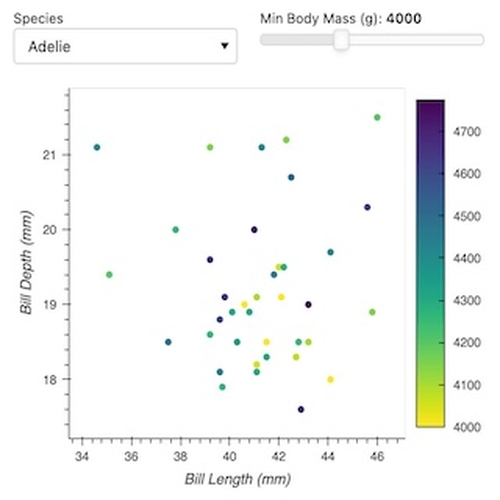
Bivariate Plot of Penguin Measurements
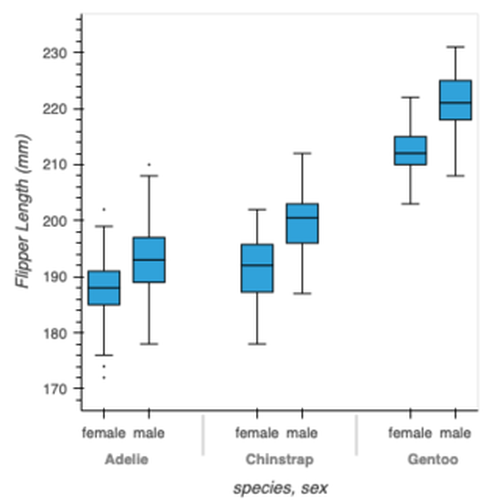
Box Plot
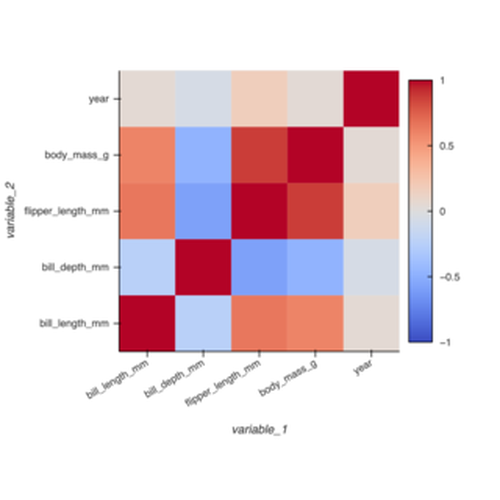
Correlation Heatmap
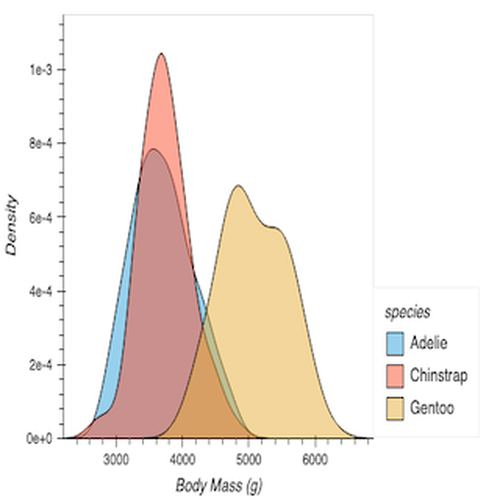
Kernel Density Estimate (KDE) Plot
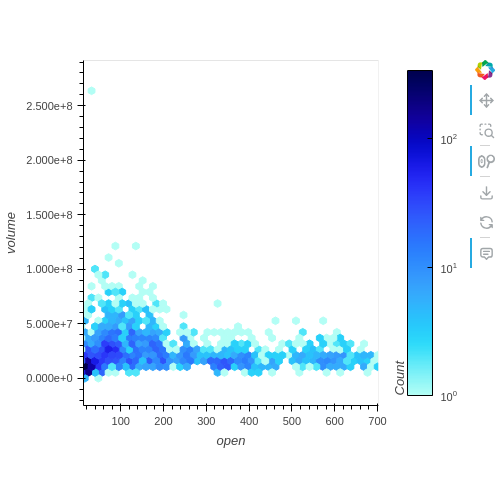
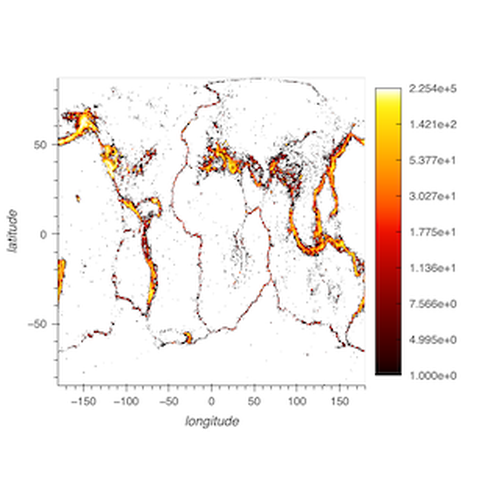
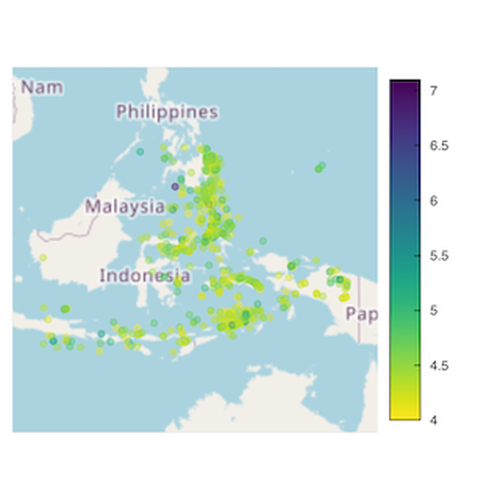
Hexbin Plot of Earthquake Locations
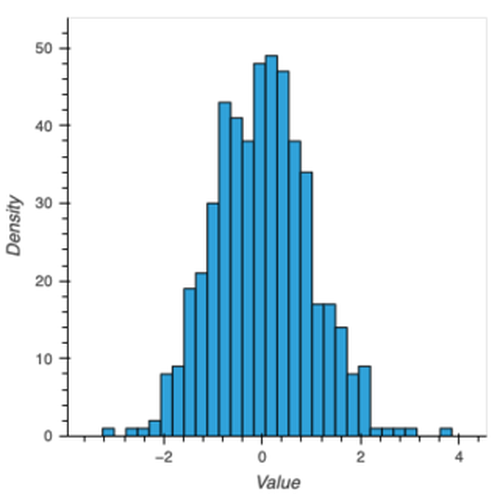
Histogram
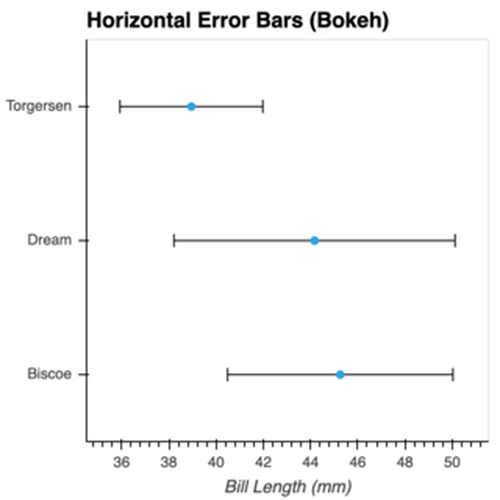
Horizontal Error Bars
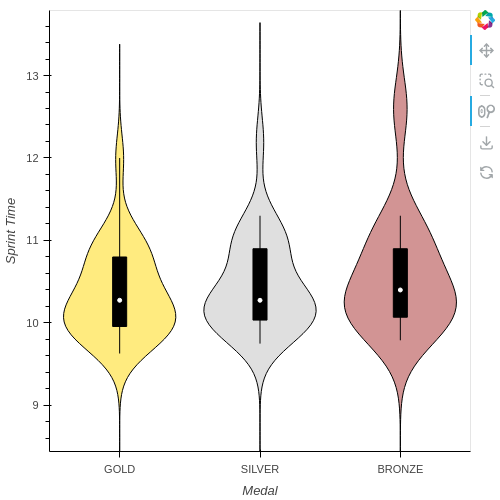
Violin Plot
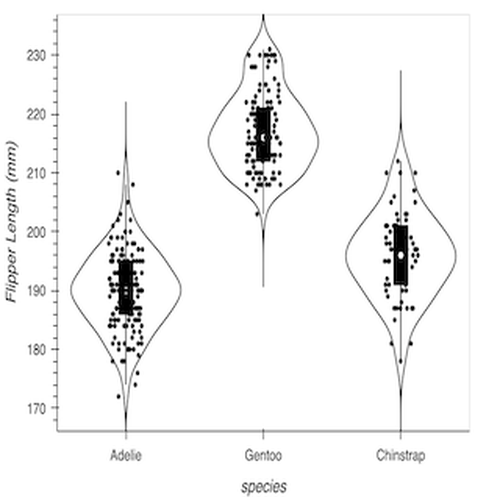
Violin Plot with Jitter
Time Series#
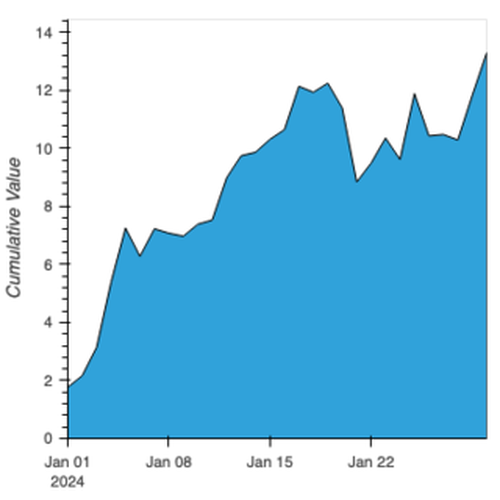
Time-Series Area Chart
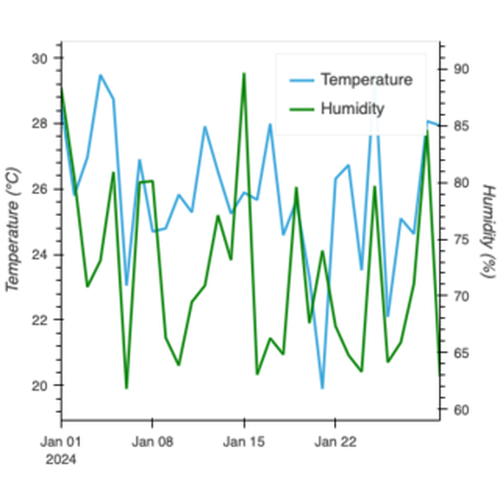
Dual-Axis Time-Series Plot
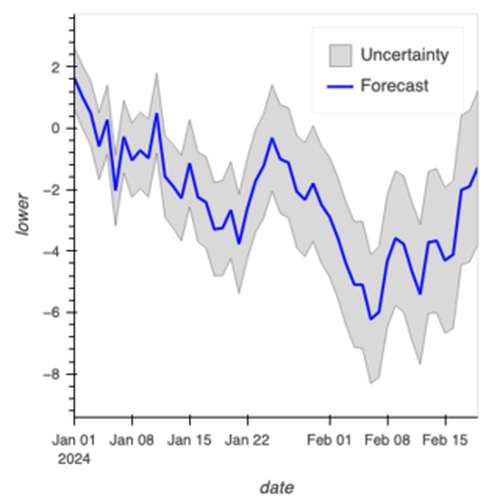
Forecast Bands (Fan Chart)
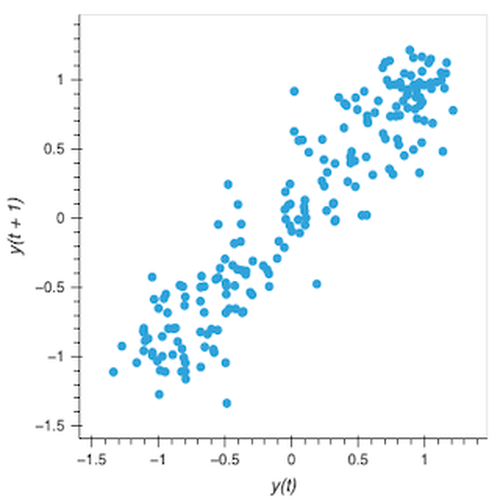
Lag Plot
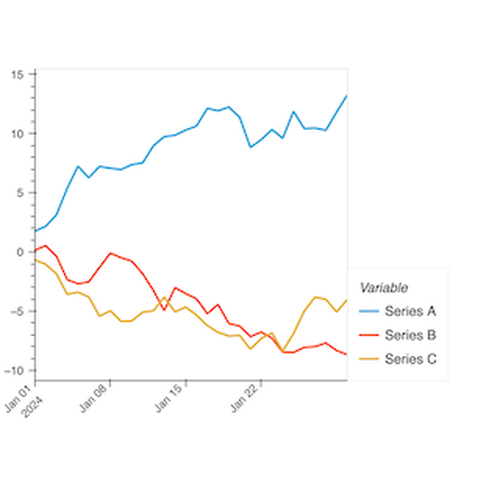
Multi-Series Time-Series Plot
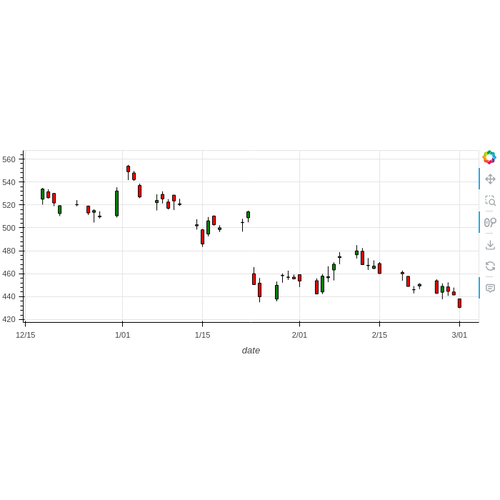
OHLC Plot with Interactive Range Tool
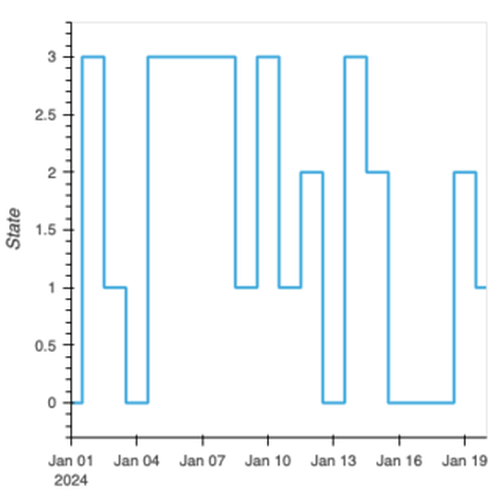
Time-Series Step Plot
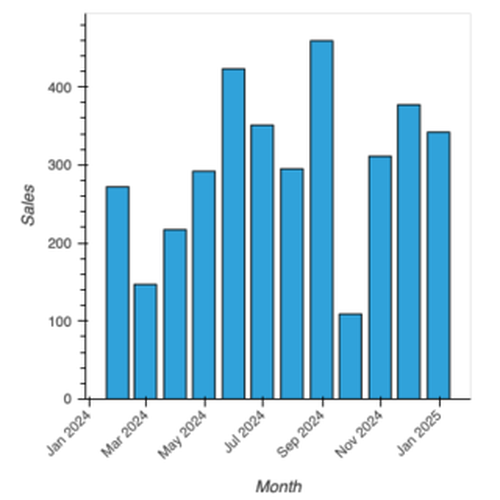
Time-Series Bar Chart
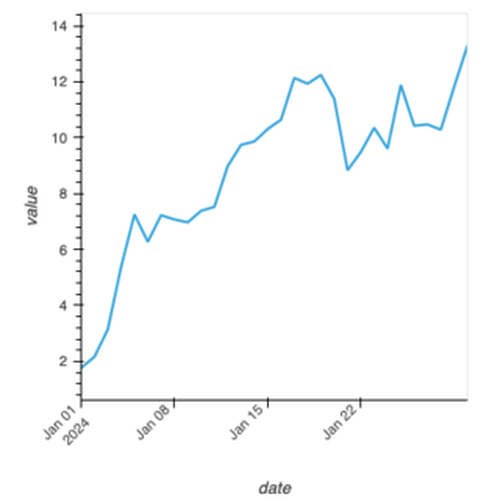
Simple Time-Series Line Plot
Geospatial#
Points Plot with Large Data
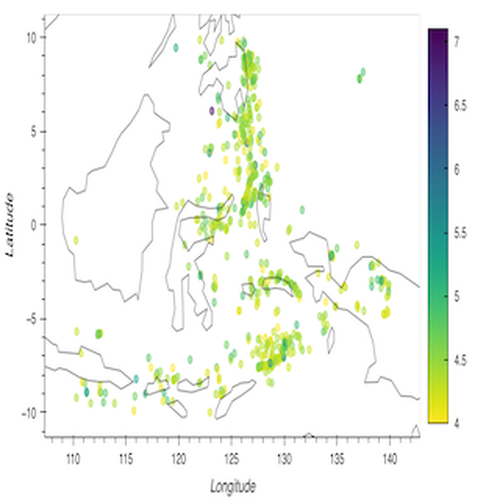
Geographic Points
Map Overlay with Tiles
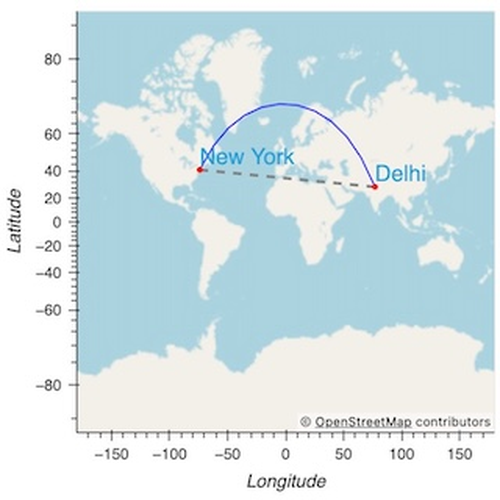
Geographic Paths and Labels
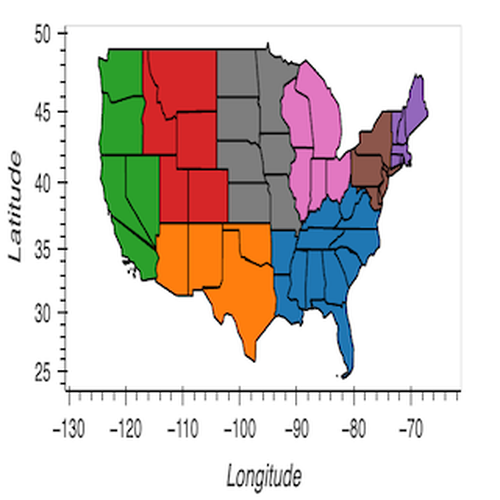
Geographic Polygon Plot
Gridded#
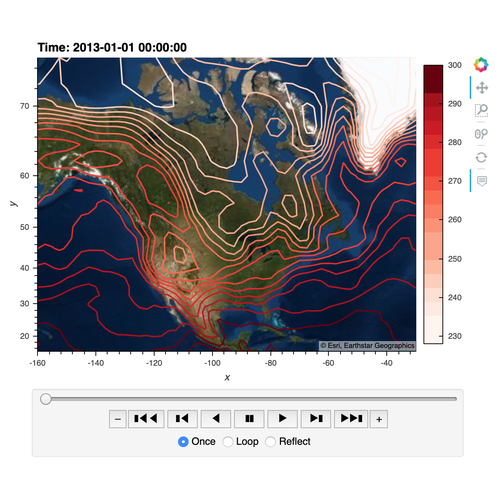
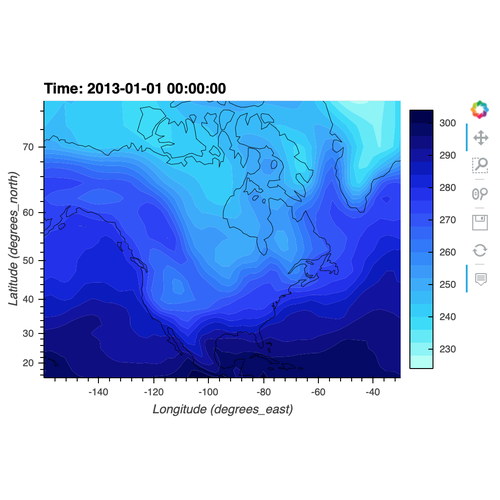
Contour Plot
Filled Contour Plot
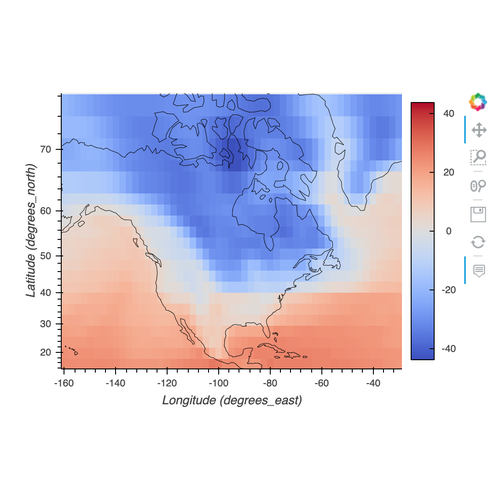
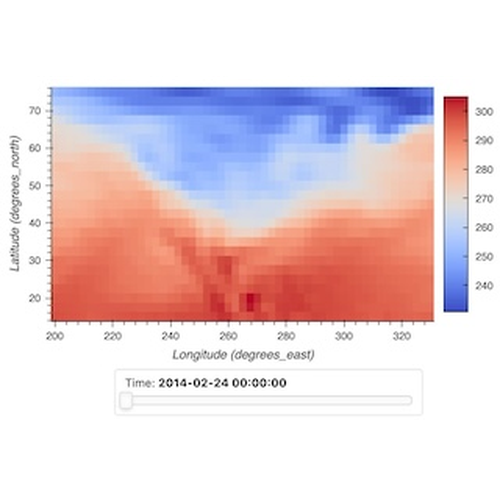
Image Plot
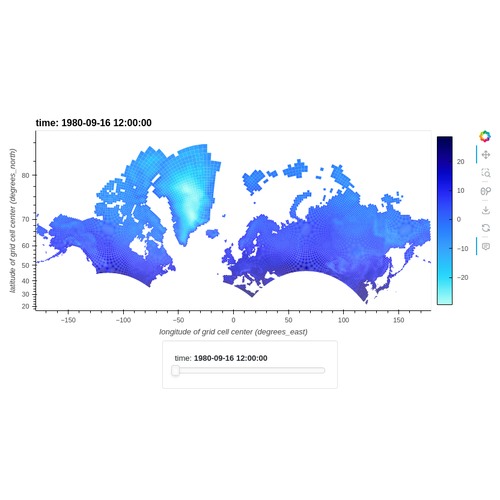
Quadmesh Plot
RGB Plot
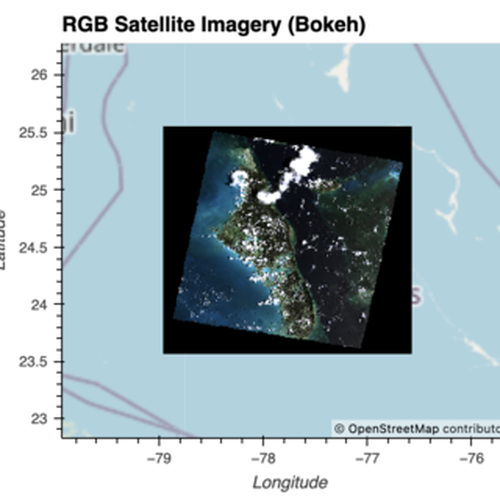
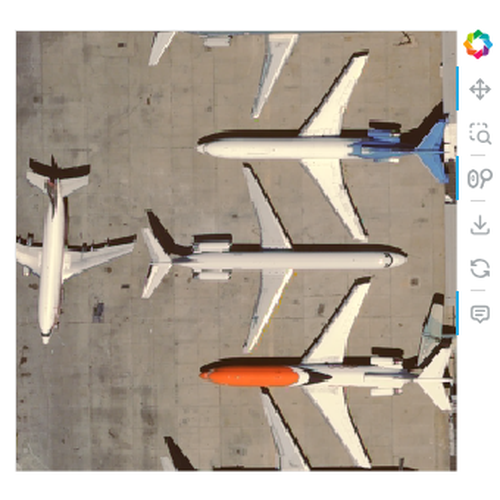
RGB Plot of Satellite Imagery
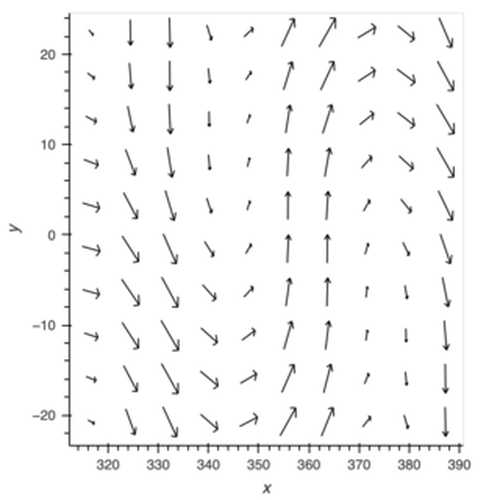
Vector Field
Big Data#
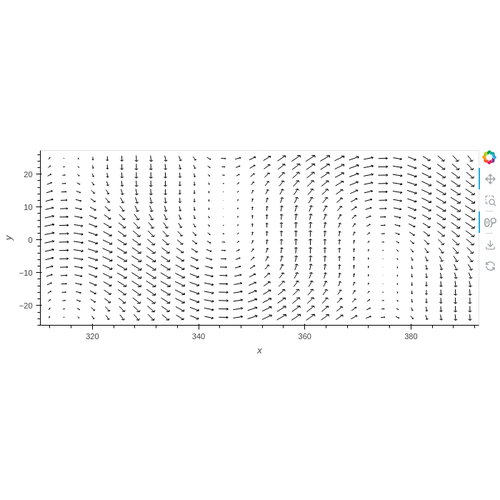
Large Vector Fields Dynamically Downsampled
Interactivity#
Interactive Panel App with bind
Interactive Panel App with rx
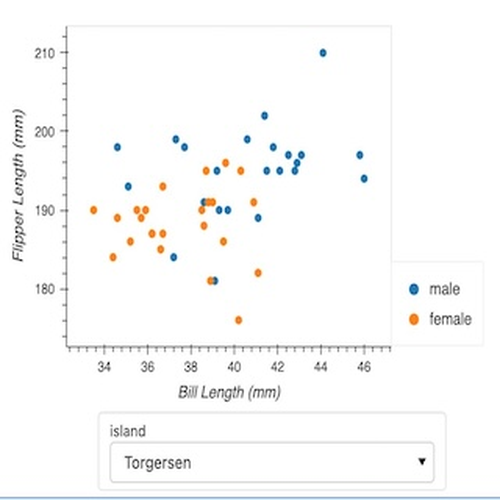
Groupby with Widget
Annotations#
Horizontal Bar Chart with Labels