
How to Display Plots in Different Environments#
This guide shows you how to display hvPlot plots in Jupyter, VS Code, Google Colab, Python scripts and the Python prompt.
Jupyter#
In a Jupyter notebook or JupyterLab, a plot is displayed when it is the last expression of a cell.
Importing a data-source integration such as hvplot.pandas registers the .hvplot API and loads the Bokeh plotting extension, so no further setup is needed to display Bokeh plots.
import hvplot.pandas  # noqa

penguins = hvplot.sampledata.penguins("pandas").dropna()
penguins.hvplot.scatter(x='bill_length_mm', y='bill_depth_mm', by='species')
Use another plotting extension#
To display plots with Matplotlib instead of Bokeh, call hvplot.extension('matplotlib') after the import. See How to Load and Switch Plotting Extensions for details.
VS Code#
Plots display inline in the notebooks of the VS Code Jupyter extension, exactly as in Jupyter. Follow the Jupyter steps above.
Google Colab#
Colab also displays plots inline. Import hvPlot as in Jupyter and, if no plot appears, call hvplot.extension('bokeh') in the cell that creates the plot.
import hvplot.pandas  # noqa

hvplot.extension('bokeh')
Scripts#
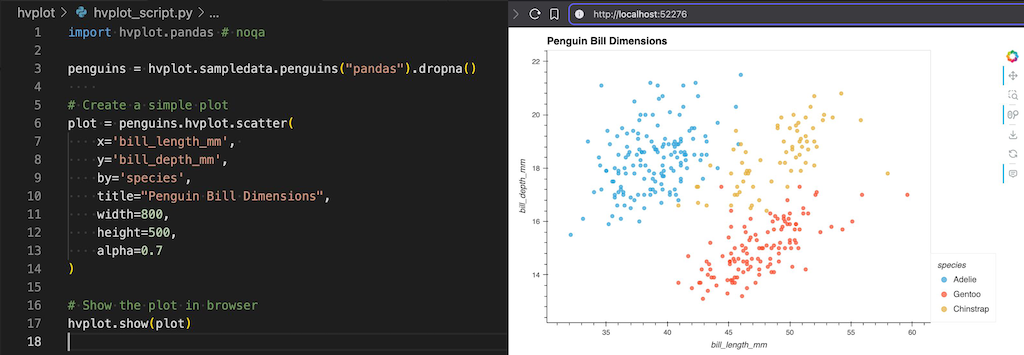
Outside of a notebook plots are not displayed automatically. Call hvplot.show() to serve the plot with a Bokeh server and open it in a new browser tab, with all its interactive features.
import hvplot.pandas  # noqa

penguins = hvplot.sampledata.penguins("pandas").dropna()
plot = penguins.hvplot.scatter(x='bill_length_mm', y='bill_depth_mm', by='species')
hvplot.show(plot)
Python prompt#
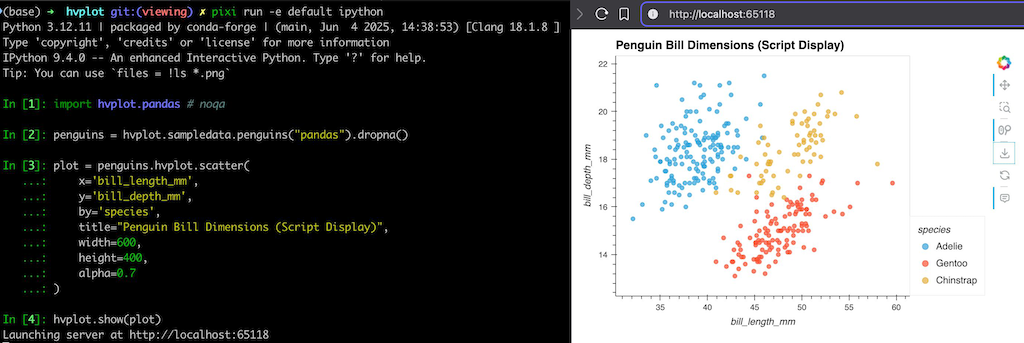
hvplot.show() works the same way in the Python REPL and IPython.
>>> import hvplot.pandas
>>> penguins = hvplot.sampledata.penguins("pandas").dropna()
>>> hvplot.show(penguins.hvplot.scatter(x='bill_length_mm', y='bill_depth_mm', by='species'))
Troubleshooting#
If hvplot.show() does not open a browser tab, save the plot as an HTML file and open it manually.
hvplot.save(plot, 'plot.html')
Next Steps