
How to Customize the Underlying Figure#
This guide shows how to customize a plot beyond what hvPlot and HoloViews options offer, by rendering it to the figure object of the plotting library (Bokeh, Matplotlib or Plotly) and editing it with that library’s own API.
Tip
Try the backend_opts option first, it sets properties of the underlying figure while keeping the plot a HoloViews object.
Create the plot#
Load the three extensions, keeping Bokeh as the active one, and create a plot as usual:
import hvplot.pandas  # noqa

hvplot.extension('bokeh', 'matplotlib', 'plotly')

penguins = hvplot.sampledata.penguins('pandas')

plot = penguins.hvplot.scatter(
    x='bill_length_mm', y='bill_depth_mm', by='species'
)
hvplot.render() converts the plot to the figure object of the extension passed as backend (the active one by default). The extension must be loaded. The examples below add a title and a subtitle, hvPlot only supports a title.
Customize a Bokeh figure#
With Bokeh, hvplot.render returns a Bokeh model, usually a figure. Edit it with the Bokeh API and display it with bokeh.io.show:
from bokeh.io import show
from bokeh.models import Title

bk_fig = hvplot.render(plot, backend='bokeh')
bk_fig.title.text = 'Penguin Bill Dimensions'
bk_fig.add_layout(Title(text='Palmer Archipelago, 2007-2009', text_font_style='italic'), 'above')
show(bk_fig)
Customize a Matplotlib figure#
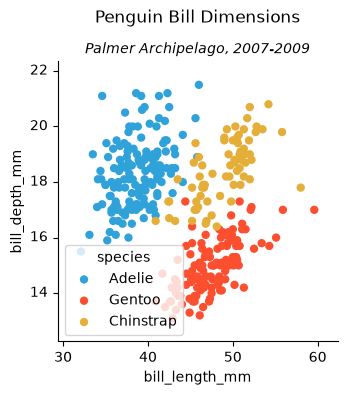
With Matplotlib, hvplot.render returns a Matplotlib Figure. Edit it, or its axes, with the Matplotlib API. In a notebook, %matplotlib inline makes the figure display as the cell output:
%matplotlib inline

mpl_fig = hvplot.render(plot, backend='matplotlib')
ax = mpl_fig.axes[0]
ax.set_title('Palmer Archipelago, 2007-2009', fontstyle='italic', fontsize=10)
mpl_fig.suptitle('Penguin Bill Dimensions')
mpl_fig
Customize a Plotly figure#
With Plotly, hvplot.render returns a dictionary. Wrap it in a Plotly Figure to use the Plotly API:
import plotly.graph_objects as go

plotly_fig = go.Figure(hvplot.render(plot, backend='plotly'))
plotly_fig.update_layout(
    title_text='Penguin Bill Dimensions',
    title_subtitle_text='Palmer Archipelago, 2007-2009',
    margin_t=80,
)
Know the trade-offs#
The changes are made after hvPlot and HoloViews have done their work, so the result is a plain Bokeh, Matplotlib or Plotly figure, no longer a HoloViews object:
It can’t be combined with other plots with
+and*, or updated with.opts().Interactive features that rely on HoloViews are lost, such as the widgets created with
groupbyand linked streams.hvplot.save()doesn’t accept it. Save it with the library’s own functions instead, e.g.bokeh.io.save,Figure.savefigwith Matplotlib, orFigure.write_htmlwith Plotly.
Do this step last, once the plot is otherwise complete.
Keep a HoloViews object with hooks#
HoloViews lets you register hooks, functions called with the plotting object and the element every time the plot is rendered. The figure is available as plot.state. Hooks are not an hvPlot option, set them with .opts(hooks=[...]). The result is still a HoloViews object, so it keeps its interactivity and can be composed and saved as usual:
def add_subtitle(plot, element):
    subtitle = Title(text='Palmer Archipelago, 2007-2009', text_font_style='italic')
    plot.state.add_layout(subtitle, 'above')

plot.opts(title='Penguin Bill Dimensions', hooks=[add_subtitle])
A hook receives the figure of the active extension, so write one per extension you plot with.
See also
How to Style Plots by Backend, for the styling options of each extension.
The Styling Options reference, for
backend_opts.