Ctrl+K
hvPlot 0.13.0 documentation - Home hvPlot 0.13.0 documentation - Home
  • Tutorials
  • User Guide
  • How-To
  • Gallery
  • Reference
  • Explanation
  • Releases
    • Contributing
    • Roadmap
    • About
  • GitHub
  • Twitter
  • Discourse
  • Discord
  • Tutorials
  • User Guide
  • How-To
  • Gallery
  • Reference
  • Explanation
  • Releases
  • Contributing
  • Roadmap
  • About
  • GitHub
  • Twitter
  • Discourse
  • Discord
  • Tutorials
    • Getting Started
    • Using hvPlot as a Pandas user
    • Explorer
    • HoloViz Tutorial
  • User Guide
    • Plotting with Bokeh
    • Plotting with Matplotlib
    • Plotting with Plotly
    • Interactive
    • Widgets
    • Gridded Data
    • Network Graphs
    • Geographic Data
    • Timeseries Data
    • Large Timeseries
  • How-To
    • Display and save plots
      • Display plots
      • Load and switch plotting extensions
      • Choose a backend for saving plots
      • Save Bokeh plots
      • Save Matplotlib plots
      • Save plots as animated GIFs
    • Style plots
      • Style plots by backend
      • Customize the underlying figure
      • Plot lines with markers
    • Combine and arrange plots
      • Overlay plots
      • Lay out plots
      • Split a plot into subplots
      • Facet plots into a grid
      • Build custom plot layouts
    • Explore multidimensional datasets
    • Use hvPlot with an AI assistant
  • Gallery
    • Basic Charts
      • Simple Area Chart
      • Simple Bar Chart
      • Simple Box Plot
      • Simple Heatmap
      • Simple Line Plot
      • Simple Scatter Plot
      • Simple Step Chart
    • Categorical
      • Category Breakdown Bar Chart
      • Category Heatmap
      • Grouped Bar Chart
      • Horizontal Bar Chart
      • Lollipop Plot
      • Stacked Bar Chart
      • Jittered Strip Plot
    • Multidimensional
      • Andrews Curves Plot
      • Faceted Time Series using Groupby
      • Parallel Coordinates Plot
      • Scatter Matrix Plot
      • Scatter with Color and Size Encoding
    • Statistical
      • Bar Chart with Error Bars
      • Bivariate Plot of Penguin Measurements
      • Box Plot
      • Correlation Heatmap
      • Kernel Density Estimate (KDE) Plot
      • Hexbin Plot of Earthquake Locations
      • Histogram
      • Horizontal Error Bars
      • Violin Plot
      • Violin Plot with Jitter
    • Time Series
      • Time-Series Area Chart
      • Dual-Axis Time-Series Plot
      • Forecast Bands (Fan Chart)
      • Lag Plot
      • Multi-Series Time-Series Plot
      • OHLC Plot with Interactive Range Tool
      • Time-Series Step Plot
      • Time-Series Bar Chart
      • Simple Time-Series Line Plot
    • Geospatial
      • Points Plot with Large Data
      • Geographic Points
      • Map Overlay with Tiles
      • Geographic Paths and Labels
      • Geographic Polygon Plot
    • Gridded
      • Contour Plot
      • Filled Contour Plot
      • Image Plot
      • Quadmesh Plot
      • RGB Plot
      • RGB Plot of Satellite Imagery
      • Vector Field
    • Big Data
      • Large Vector Fields Dynamically Downsampled
    • Interactivity
      • Interactive Panel App with bind
      • Interactive Panel App with rx
      • Groupby with Widget
    • Annotations
      • Horizontal Bar Chart with Labels
  • Reference
    • API
      • hvplot.help
      • hvplot.hvplot_extension
      • hvplot.extension
      • hvplot.output
      • hvplot.render
      • hvplot.save
      • hvplot.show
      • hvplot.hvPlot.area
      • hvplot.hvPlot.bar
      • hvplot.hvPlot.barh
      • hvplot.hvPlot.box
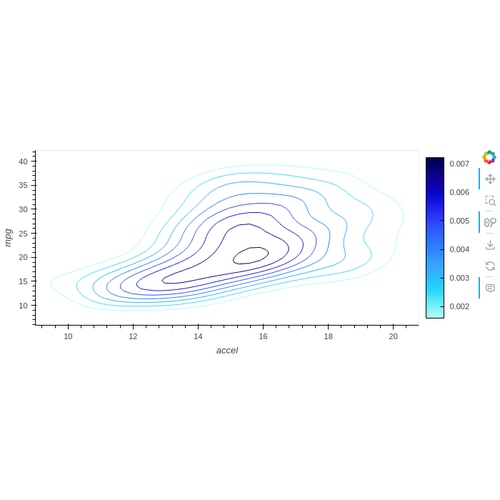
      • hvplot.hvPlot.bivariate
      • hvplot.hvPlot.contour
      • hvplot.hvPlot.contourf
      • hvplot.hvPlot.dataset
      • hvplot.hvPlot.density
      • hvplot.hvPlot.errorbars
      • hvplot.hvPlot.heatmap
      • hvplot.hvPlot.hexbin
      • hvplot.hvPlot.hist
      • hvplot.hvPlot.image
      • hvplot.hvPlot.kde
      • hvplot.hvPlot.labels
      • hvplot.hvPlot.line
      • hvplot.hvPlot.ohlc
      • hvplot.hvPlot.paths
      • hvplot.hvPlot.points
      • hvplot.hvPlot.polygons
      • hvplot.hvPlot.quadmesh
      • hvplot.hvPlot.rgb
      • hvplot.hvPlot.scatter
      • hvplot.hvPlot.step
      • hvplot.hvPlot.table
      • hvplot.hvPlot.vectorfield
      • hvplot.hvPlot.violin
      • hvplot.plotting.andrews_curves
      • hvplot.plotting.lag_plot
      • hvplot.plotting.parallel_coordinates
      • hvplot.plotting.scatter_matrix
      • hvplot.networkx.draw
      • hvplot.networkx.draw_networkx
      • hvplot.networkx.draw_networkx_nodes
      • hvplot.networkx.draw_networkx_edges
      • hvplot.networkx.draw_networkx_labels
      • hvplot.networkx.draw_circular
      • hvplot.networkx.draw_kamada_kawai
      • hvplot.networkx.draw_random
      • hvplot.networkx.draw_planar
      • hvplot.networkx.draw_shell
      • hvplot.networkx.draw_spectral
      • hvplot.networkx.draw_spring
      • hvplot.hvPlot.explorer
      • hvplot.ui.explorer
      • hvplot.ui.hvPlotExplorer
      • hvplot.ui.hvPlotExplorer.hvplot
      • hvplot.ui.hvPlotExplorer.plot_code
      • hvplot.ui.hvPlotExplorer.save
      • hvplot.ui.hvPlotExplorer.servable
      • hvplot.ui.hvPlotExplorer.settings
      • hvplot.ui.hvPlotExplorer.show
    • Plotting options
      • All Options
      • Data Options
      • Size And Layout Options
      • Axis Options
      • Color And Colormap Options
      • Styling Options
      • Legend Options
      • Interactivity Options
      • Resampling Options
      • Geographic Options
      • Streaming Options
    • Supported data libraries
    • Supported plotting extensions
    • API compatibility
      • Pandas
        • Comparison with Pandas API
      • Panel Widgets
    • Installation
    • Deprecations/Removals
  • Explanation
    • Wide and long data
    • Grouping and coloring options
    • Statistical plot types
    • Plotting backend support
  • Releases
  • Contributing
  • Roadmap
  • About
HoloViz.org
  • Panel
  • HoloViews
  • GeoViews
  • Datashader
  • Param
  • Lumen
  • Colorcet

  • Examples Gallery
  • Blog
  • Gallery

Gallery#

Explore a curated set of example visualizations using hvPlot with different backends and datasets. For more examples using hvPlot and other HoloViz tools to solve real world problems, see the HoloViz Examples website.

API Reference#

One example per plotting method, linking to its API reference page.

area
../ref/api/manual/hvplot.hvPlot.area.html
bar
../ref/api/manual/hvplot.hvPlot.bar.html
barh
../ref/api/manual/hvplot.hvPlot.barh.html
bivariate
../ref/api/manual/hvplot.hvPlot.bivariate.html
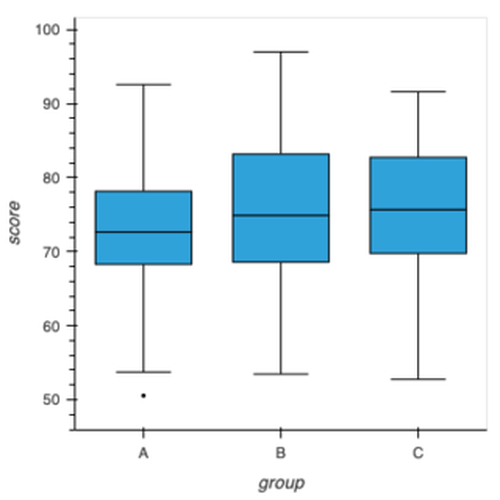
box
../ref/api/manual/hvplot.hvPlot.box.html
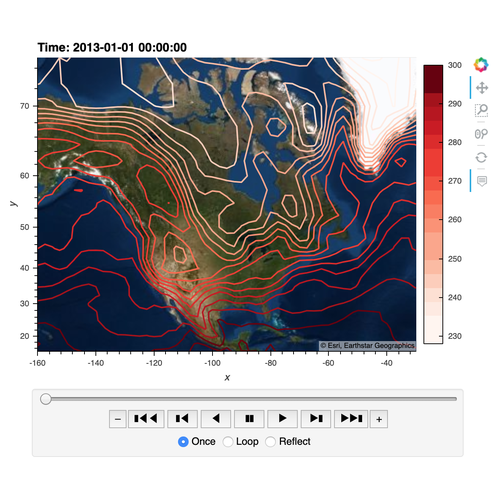
contour
../ref/api/manual/hvplot.hvPlot.contour.html
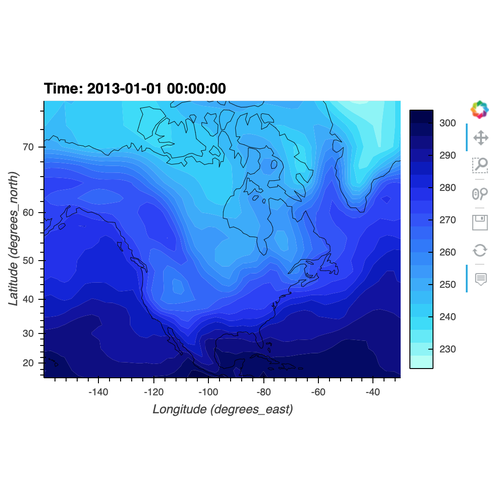
contourf
../ref/api/manual/hvplot.hvPlot.contourf.html
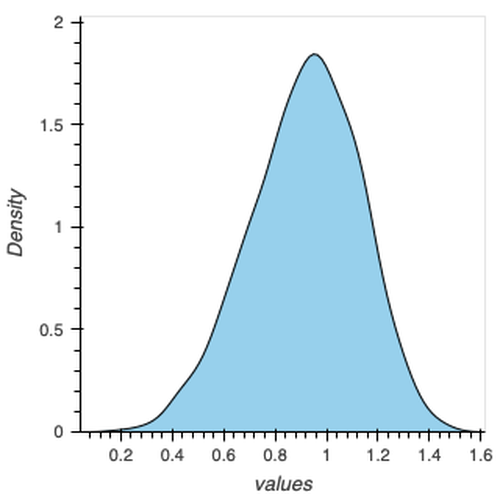
density
../ref/api/manual/hvplot.hvPlot.density.html
errorbars
../ref/api/manual/hvplot.hvPlot.errorbars.html
heatmap
../ref/api/manual/hvplot.hvPlot.heatmap.html
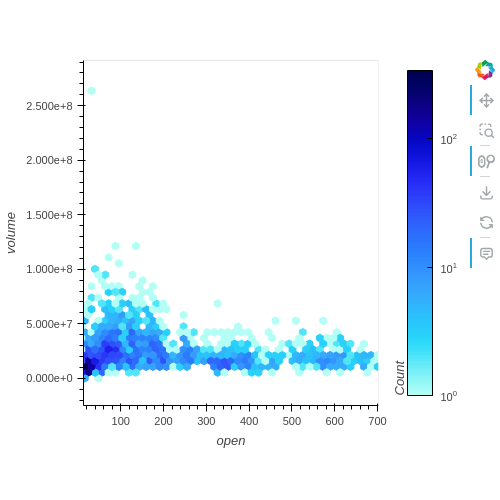
hexbin
../ref/api/manual/hvplot.hvPlot.hexbin.html
hist
../ref/api/manual/hvplot.hvPlot.hist.html
image
../ref/api/manual/hvplot.hvPlot.image.html
kde
../ref/api/manual/hvplot.hvPlot.kde.html
labels
../ref/api/manual/hvplot.hvPlot.labels.html
line
../ref/api/manual/hvplot.hvPlot.line.html
ohlc
../ref/api/manual/hvplot.hvPlot.ohlc.html
paths
../ref/api/manual/hvplot.hvPlot.paths.html
points
../ref/api/manual/hvplot.hvPlot.points.html
polygons
../ref/api/manual/hvplot.hvPlot.polygons.html
quadmesh
../ref/api/manual/hvplot.hvPlot.quadmesh.html
rgb
../ref/api/manual/hvplot.hvPlot.rgb.html
scatter
../ref/api/manual/hvplot.hvPlot.scatter.html
step
../ref/api/manual/hvplot.hvPlot.step.html
table
../ref/api/manual/hvplot.hvPlot.table.html
vectorfield
../ref/api/manual/hvplot.hvPlot.vectorfield.html
violin
../ref/api/manual/hvplot.hvPlot.violin.html
andrews_curves
../ref/api/manual/hvplot.plotting.andrews_curves.html
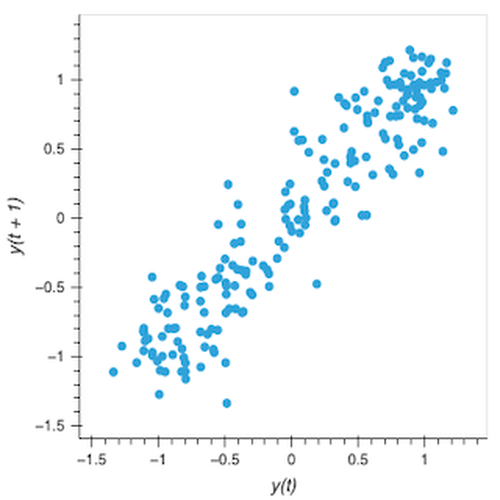
lag_plot
../ref/api/manual/hvplot.plotting.lag_plot.html
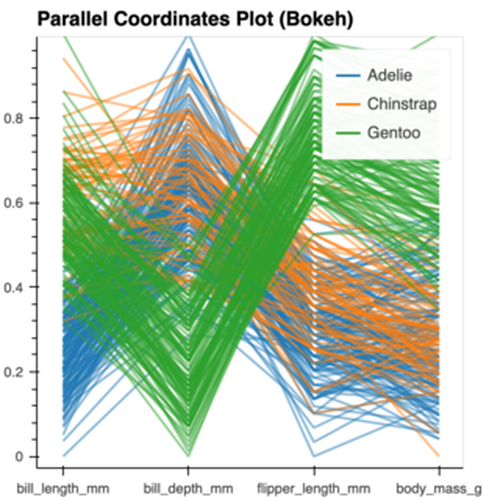
parallel_coordinates
../ref/api/manual/hvplot.plotting.parallel_coordinates.html
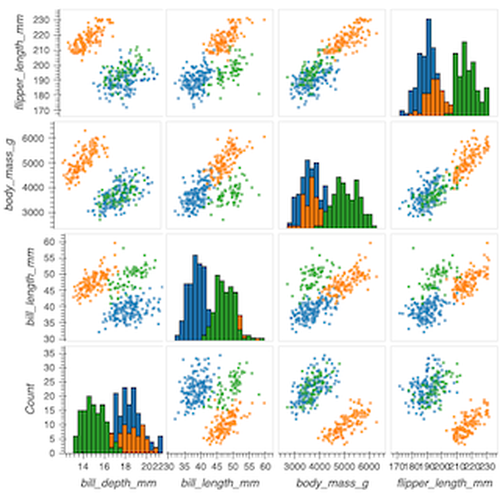
scatter_matrix
../ref/api/manual/hvplot.plotting.scatter_matrix.html

Basic Charts#
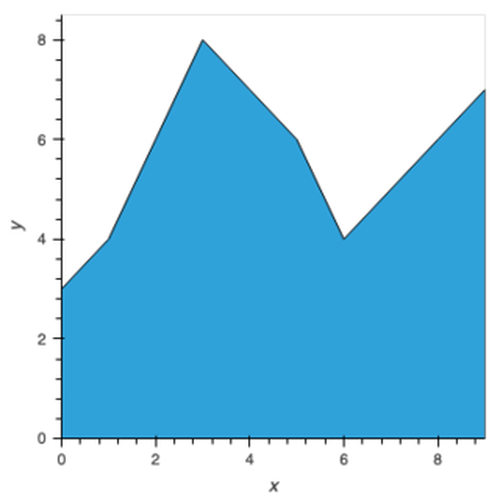
Simple Area Chart
Simple Area Chart

Simple Area Chart
Simple Bar Chart

Simple Bar Chart

Simple Bar Chart
Simple Box Plot
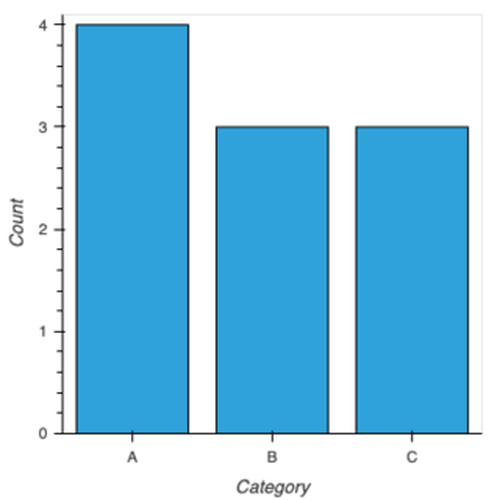
Simple Box Plot

Simple Box Plot
Simple Heatmap

Simple Heatmap

Simple Heatmap
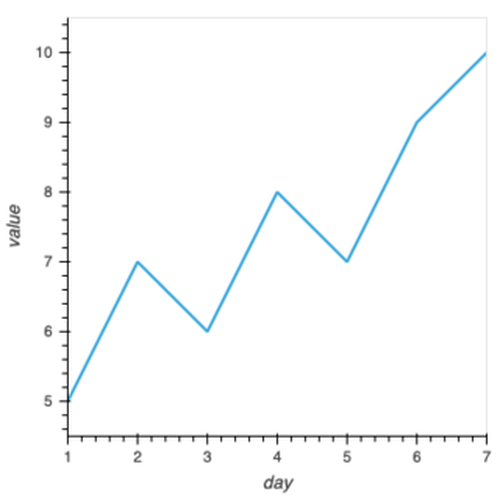
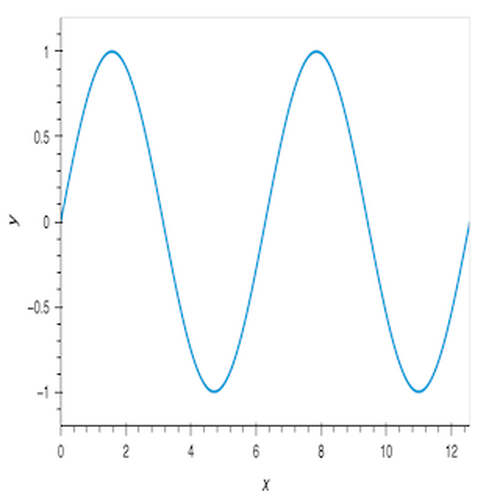
Simple Line Plot

Simple Line Plot

Simple Line Plot
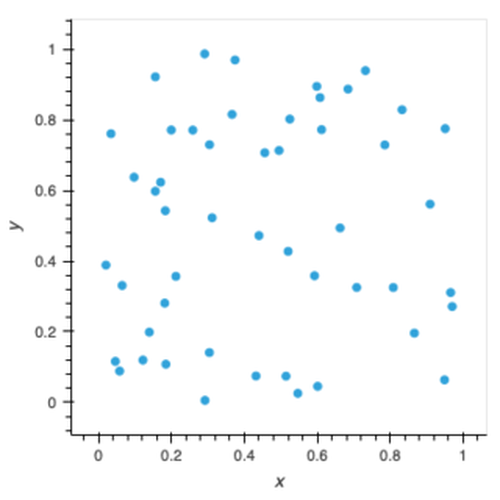
Simple Scatter Plot
Simple Scatter Plot

Simple Scatter Plot
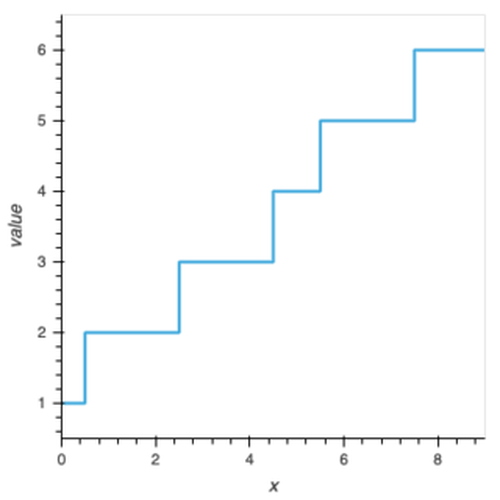
Simple Step Chart

Simple Step Chart

Simple Step Chart

Categorical#

Category Breakdown Bar Chart
Category Breakdown Bar Chart

Category Breakdown Bar Chart
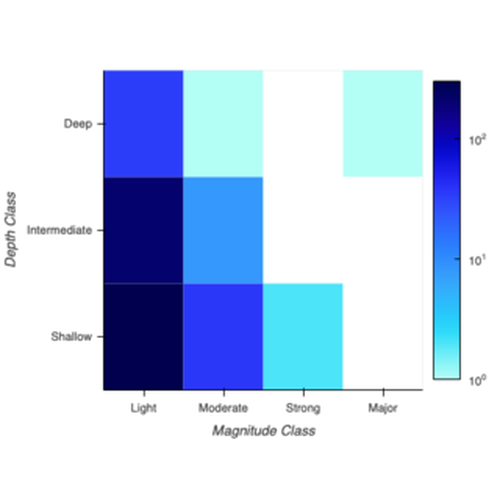
Category Heatmap
Category Heatmap

Category Heatmap
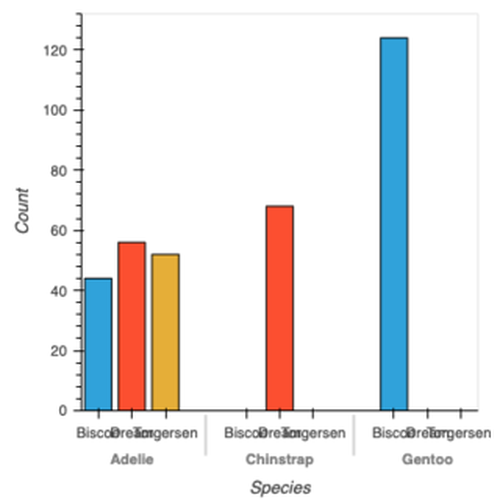
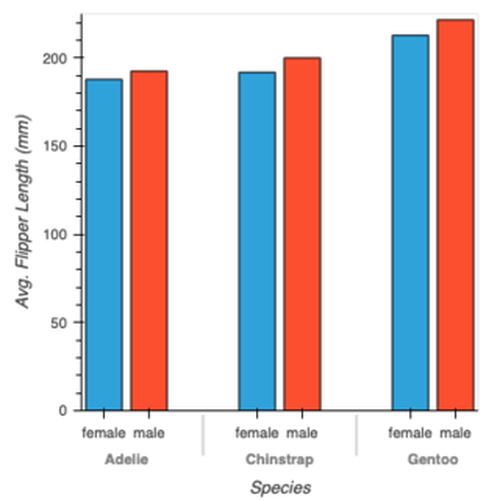
Grouped Bar Chart

Grouped Bar Chart

Grouped Bar Chart
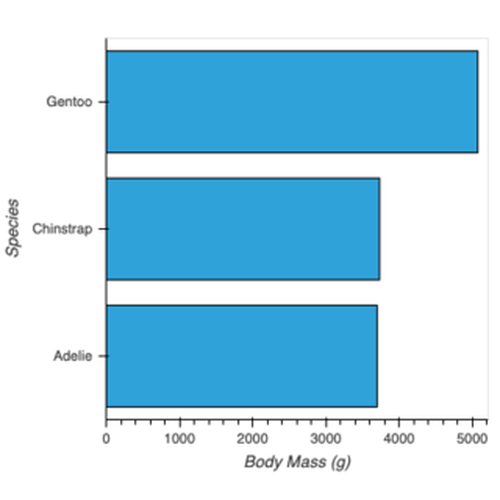
Horizontal Bar Chart
Horizontal Bar Chart

Horizontal Bar Chart
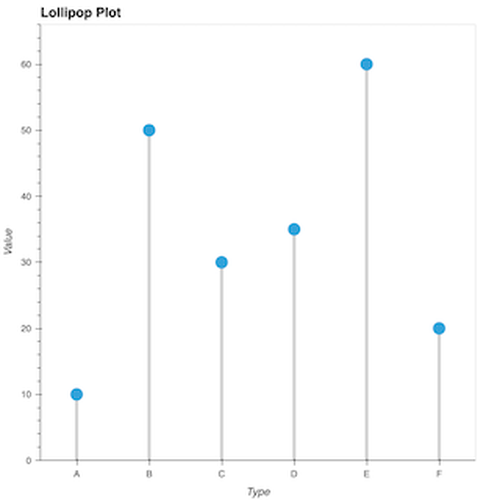
Lollipop Plot
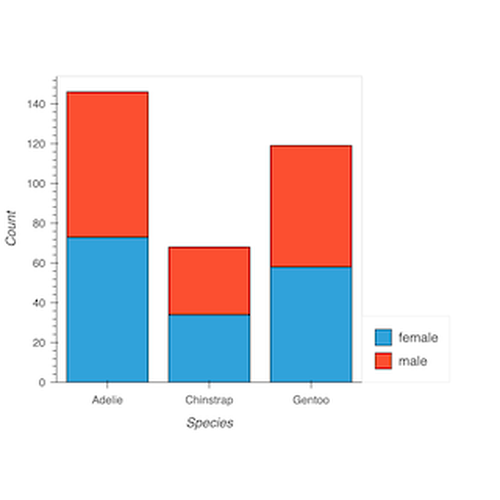
Lollipop Plot

Lollipop Plot
Stacked Bar Chart

Stacked Bar Chart

Stacked Bar Chart
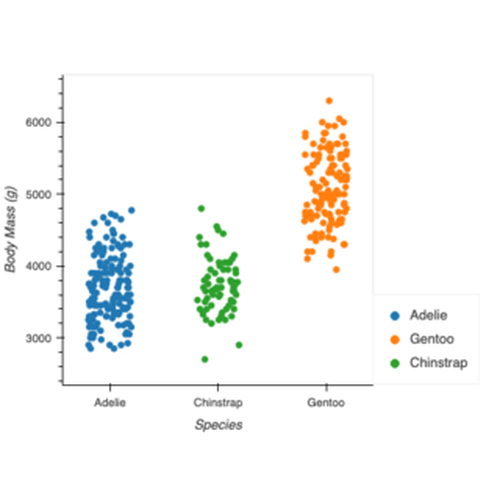
Jittered Strip Plot

Jittered Strip Plot

Jittered Strip Plot

Multidimensional#
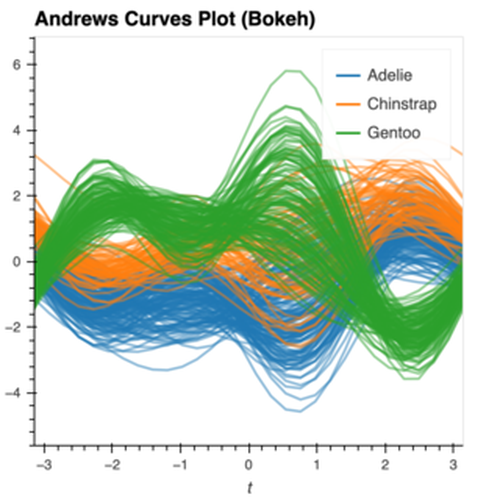
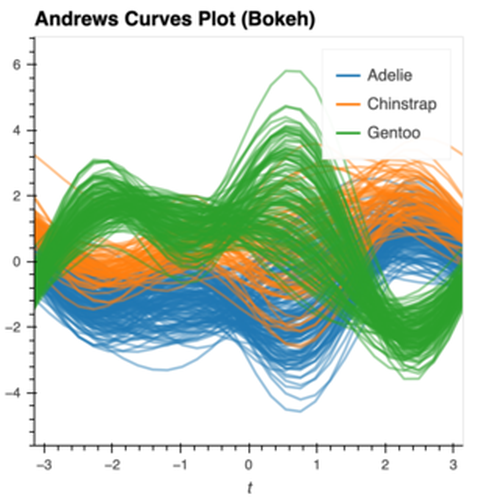
Andrews Curves Plot
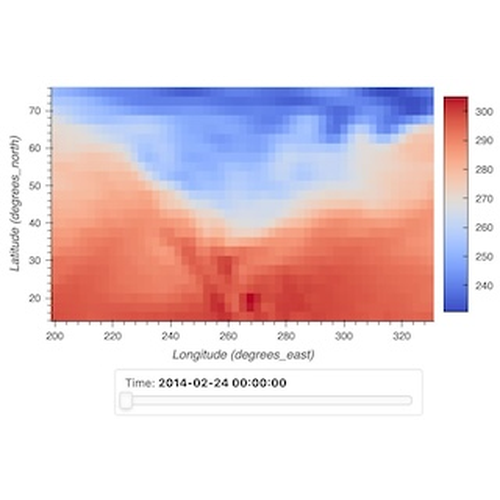
Andrews Curves Plot

Andrews Curves Plot
Faceted Time Series using Groupby
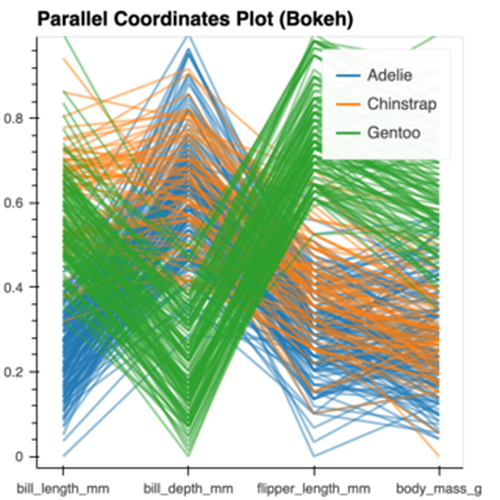
Faceted Time Series using Groupby

Faceted Time Series using Groupby
Parallel Coordinates Plot
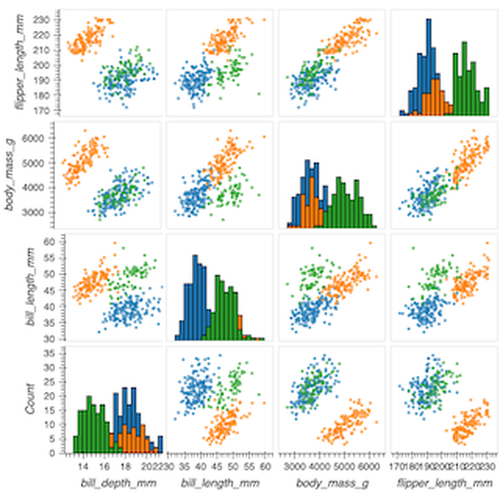
Parallel Coordinates Plot

Parallel Coordinates Plot
Scatter Matrix Plot
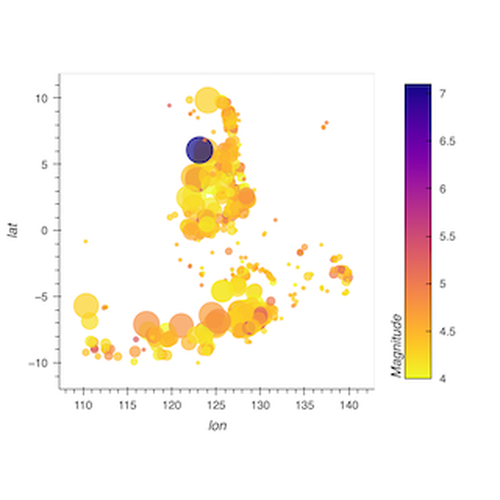
Scatter Matrix Plot

Scatter Matrix Plot
Scatter with Color and Size Encoding

Scatter with Color and Size Encoding

Scatter with Color and Size Encoding

Statistical#
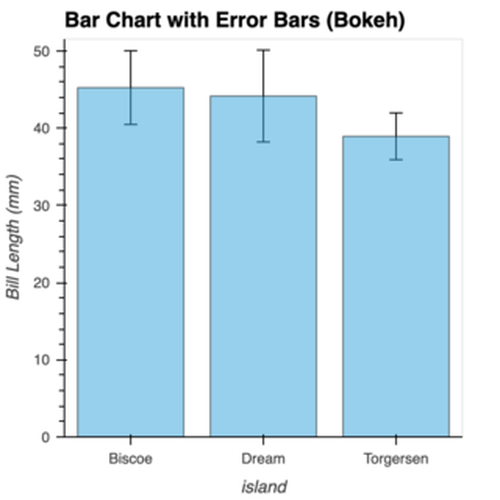
Bar Chart with Error Bars
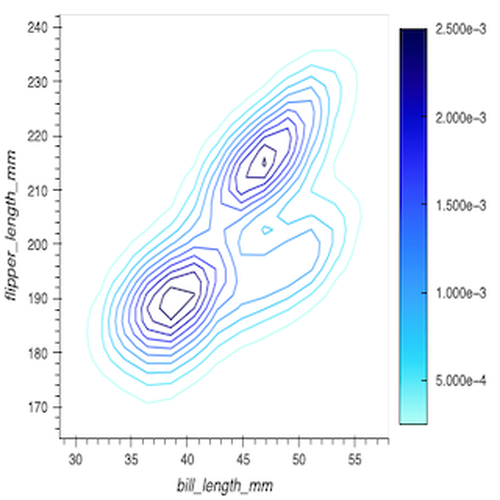
Bar Chart with Error Bars

Bar Chart with Error Bars
Bivariate Plot of Penguin Measurements
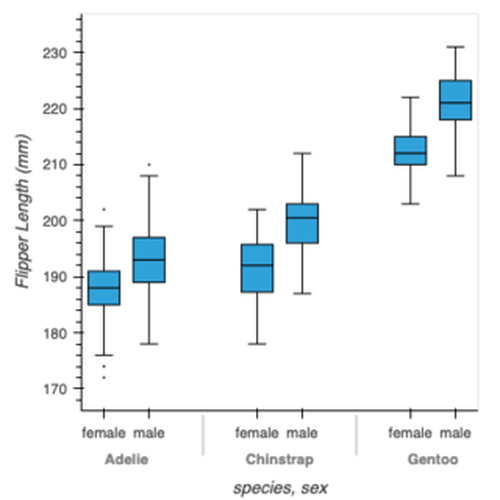
Bivariate Plot of Penguin Measurements

Bivariate Plot of Penguin Measurements
Box Plot
Box Plot

Box Plot
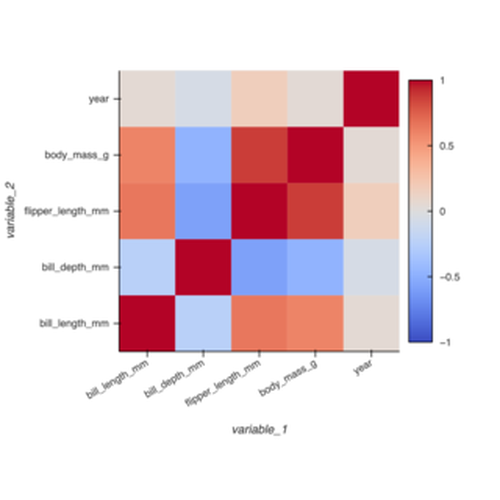
Correlation Heatmap

Correlation Heatmap

Correlation Heatmap
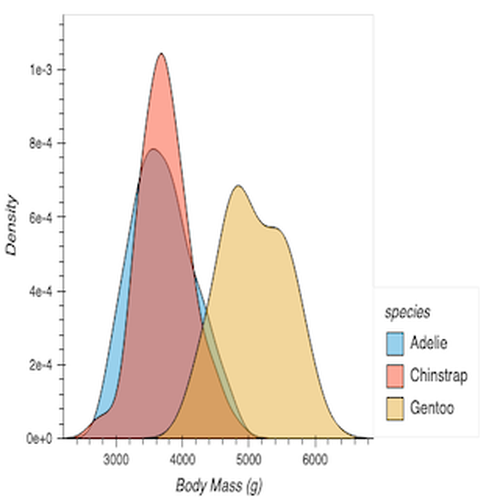
Kernel Density Estimate (KDE) Plot
Kernel Density Estimate (KDE) Plot

Kernel Density Estimate (KDE) Plot
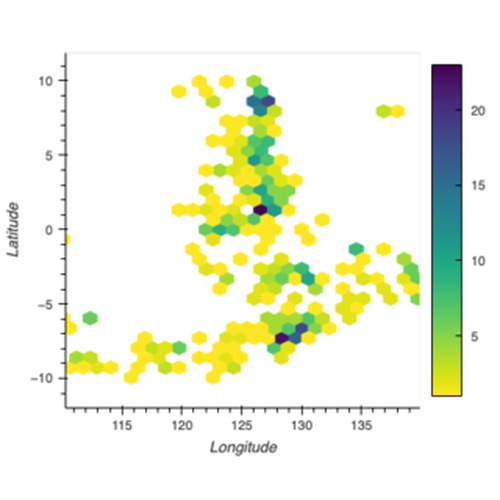
Hexbin Plot of Earthquake Locations
Hexbin Plot of Earthquake Locations

Hexbin Plot of Earthquake Locations
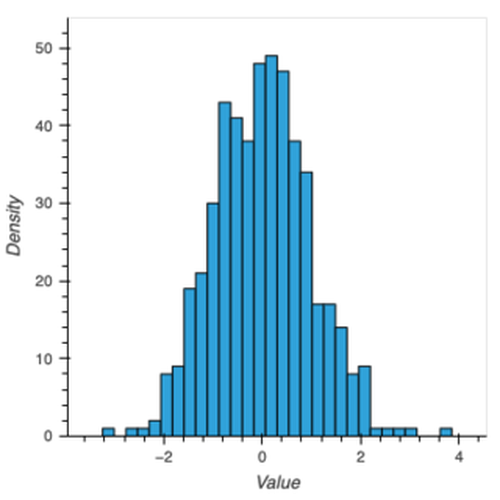
Histogram
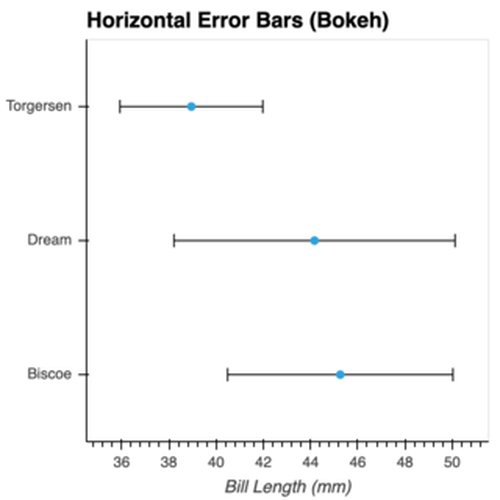
Histogram

Histogram
Horizontal Error Bars

Horizontal Error Bars

Horizontal Error Bars
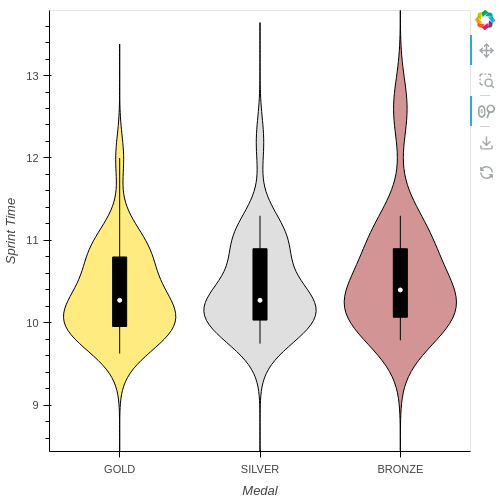
Violin Plot

Violin Plot

Violin Plot
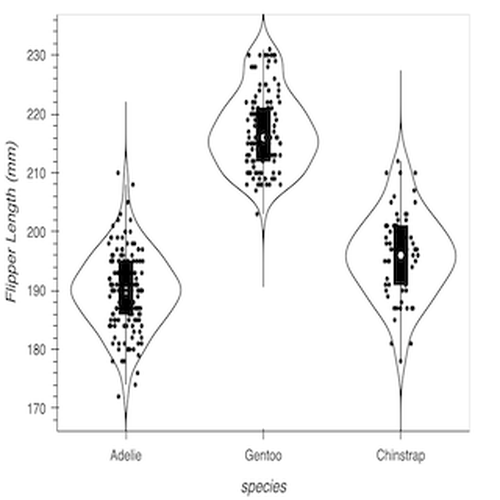
Violin Plot with Jitter

Violin Plot with Jitter

Violin Plot with Jitter

Time Series#

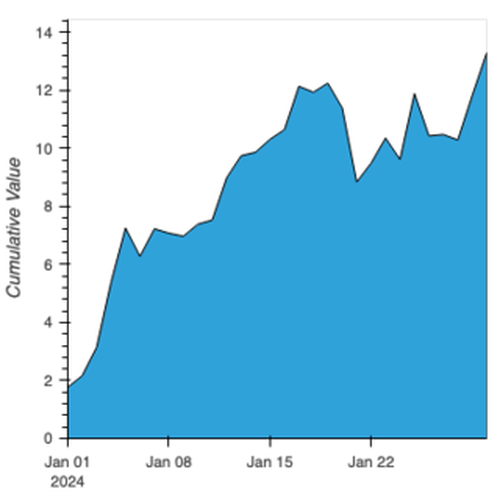
Time-Series Area Chart
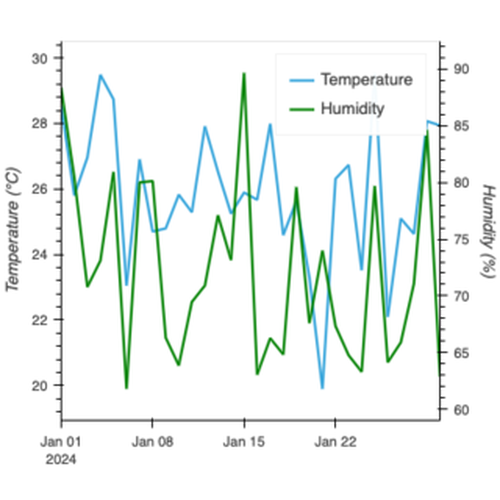
Time-Series Area Chart

Time-Series Area Chart
Dual-Axis Time-Series Plot
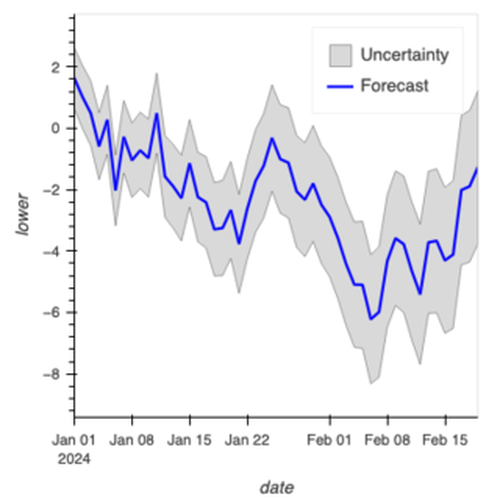
Dual-Axis Time-Series Plot

Dual-Axis Time-Series Plot
Forecast Bands (Fan Chart)
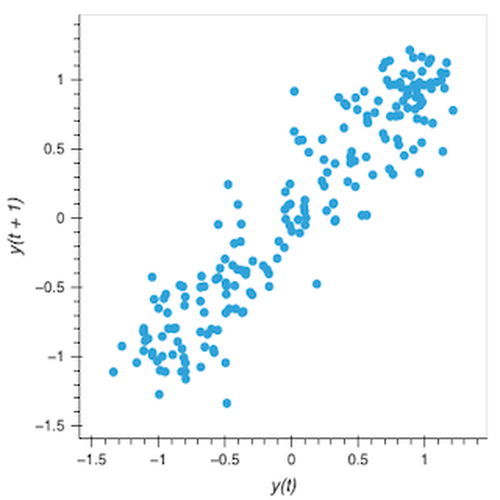
Forecast Bands (Fan Chart)

Forecast Bands (Fan Chart)
Lag Plot

Lag Plot

Lag Plot
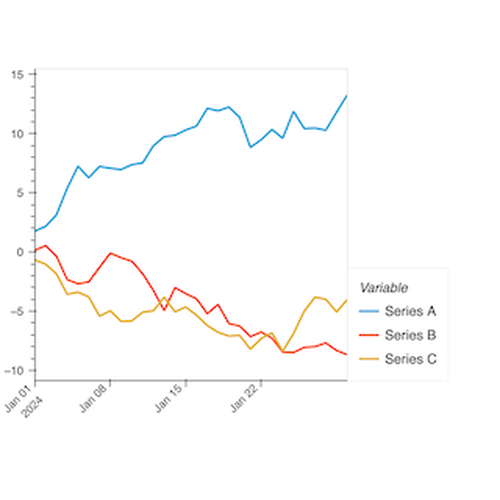
Multi-Series Time-Series Plot
Multi-Series Time-Series Plot

Multi-Series Time-Series Plot
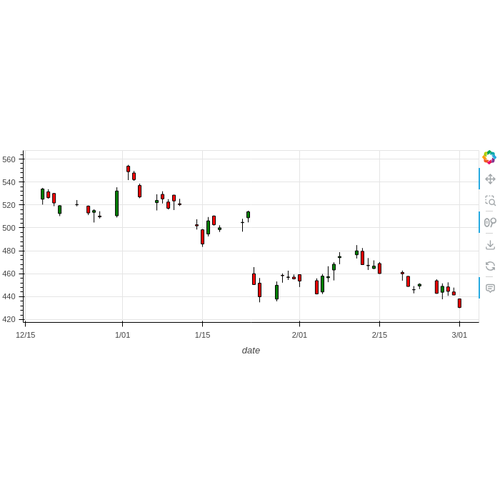
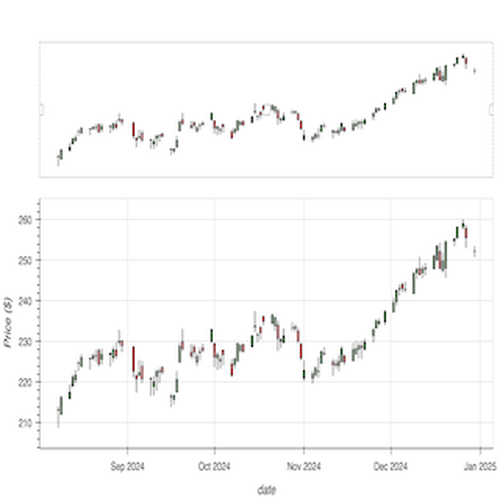
OHLC Plot with Interactive Range Tool
OHLC Plot with Interactive Range Tool

OHLC Plot with Interactive Range Tool
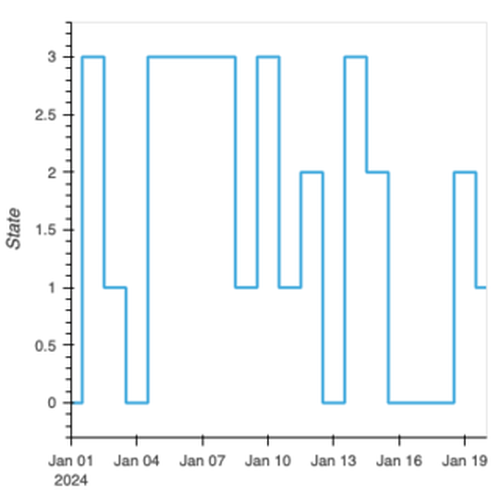
Time-Series Step Plot
Time-Series Step Plot

Time-Series Step Plot
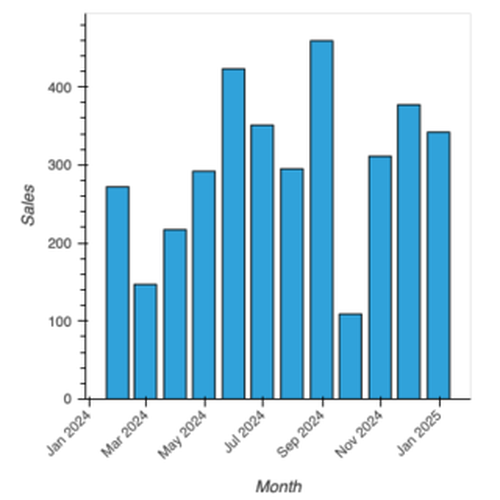
Time-Series Bar Chart
Time-Series Bar Chart

Time-Series Bar Chart
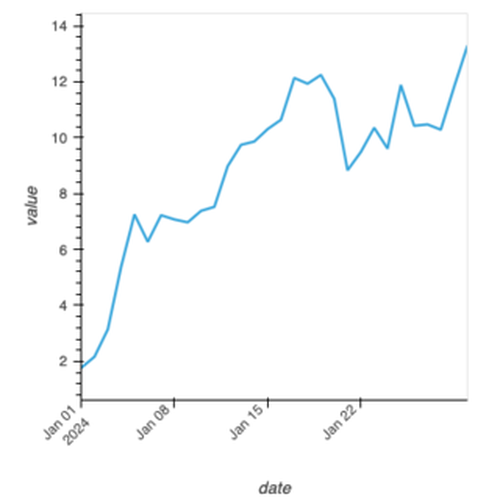
Simple Time-Series Line Plot

Simple Time-Series Line Plot

Simple Time-Series Line Plot

Geospatial#
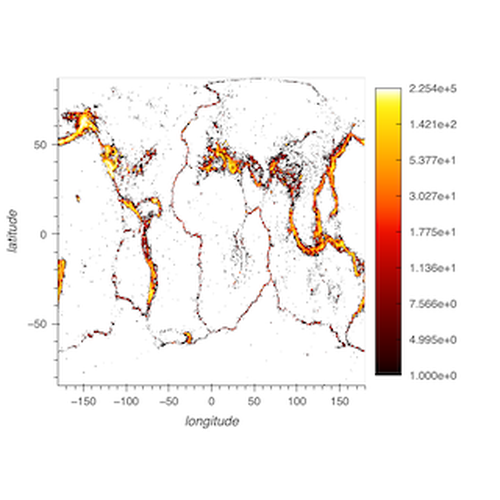
Points Plot with Large Data
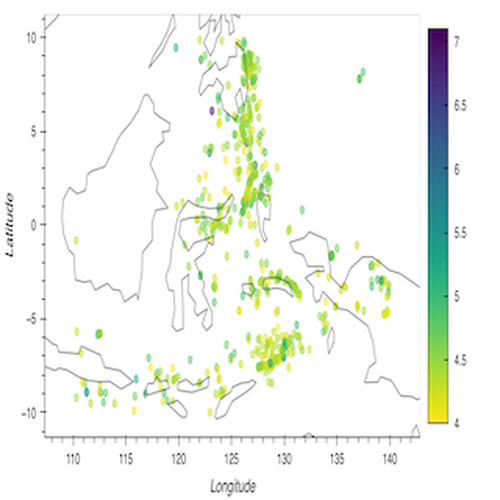
Points Plot with Large Data

Points Plot with Large Data
Geographic Points
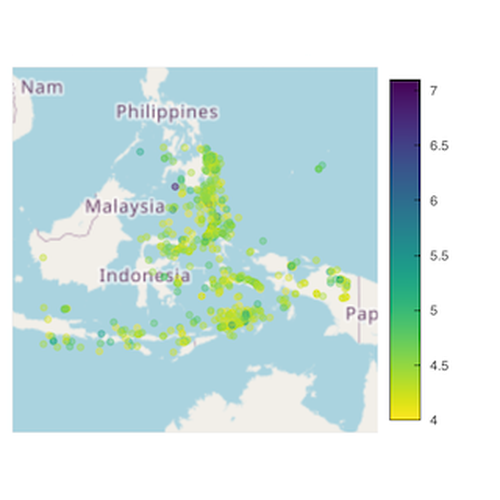
Geographic Points

Geographic Points
Map Overlay with Tiles
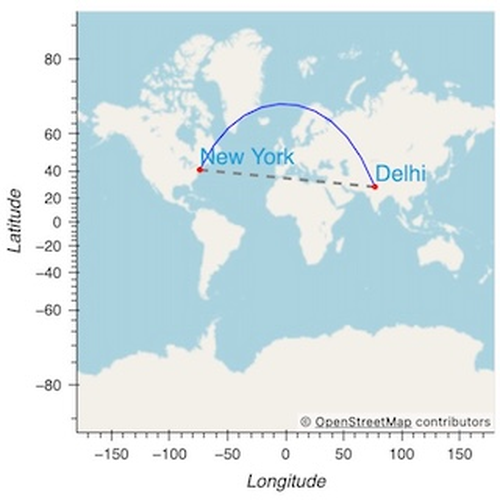
Map Overlay with Tiles

Map Overlay with Tiles
Geographic Paths and Labels
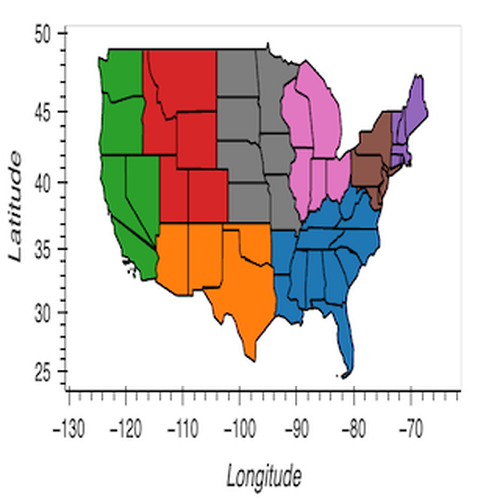
Geographic Paths and Labels

Geographic Paths and Labels
Geographic Polygon Plot

Geographic Polygon Plot

Geographic Polygon Plot

Gridded#

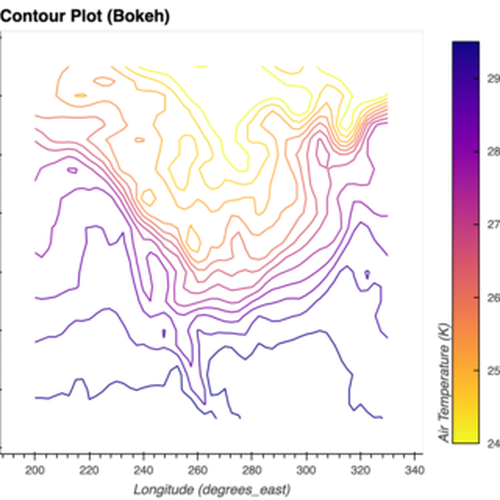
Contour Plot
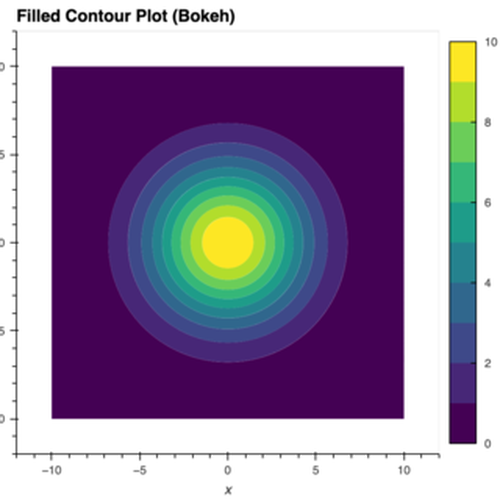
Contour Plot

Contour Plot
Filled Contour Plot

Filled Contour Plot

Filled Contour Plot
Image Plot
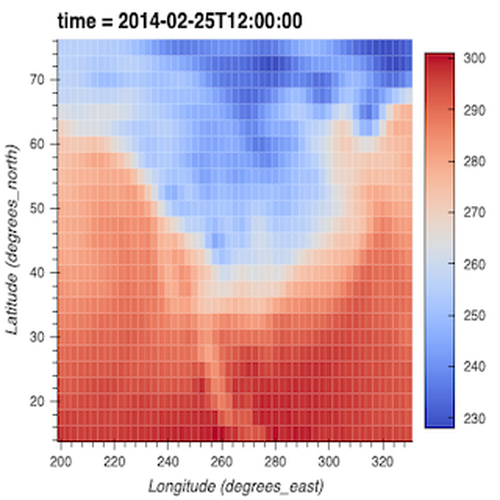
Image Plot

Image Plot
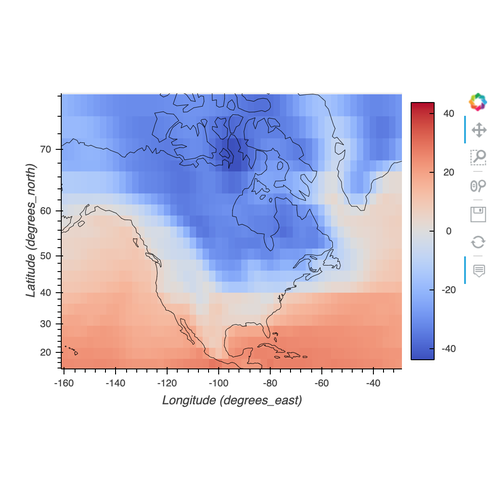
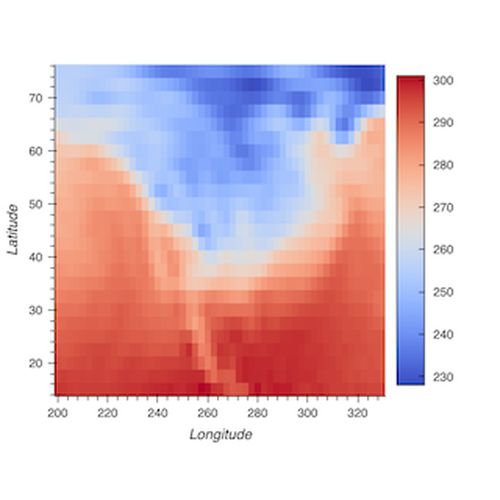
Quadmesh Plot

Quadmesh Plot

Quadmesh Plot
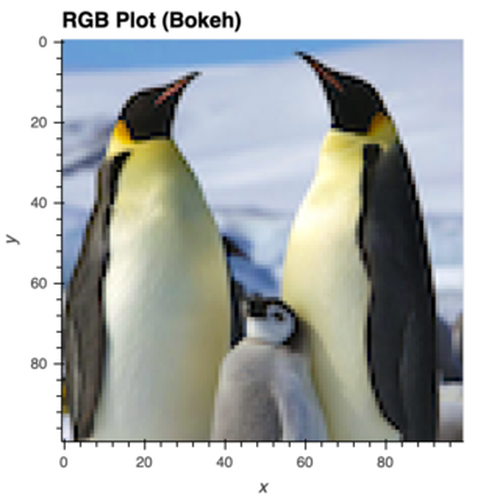
RGB Plot

RGB Plot

RGB Plot
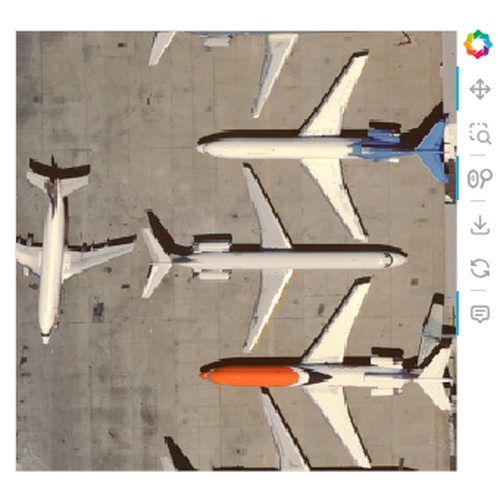
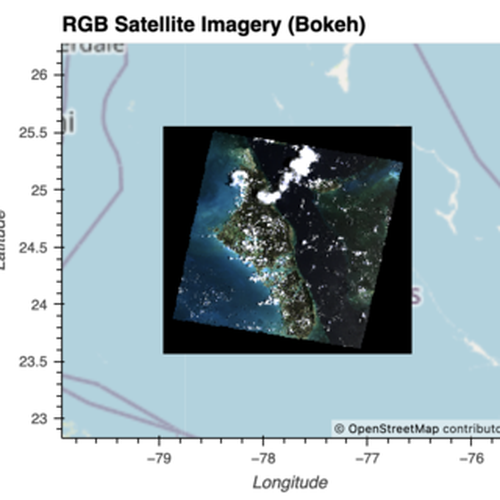
RGB Plot of Satellite Imagery
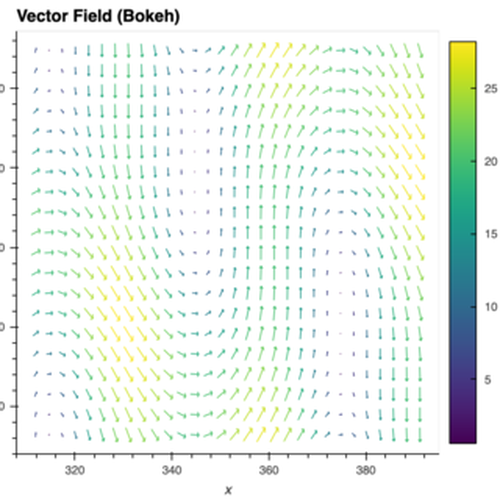
RGB Plot of Satellite Imagery

RGB Plot of Satellite Imagery
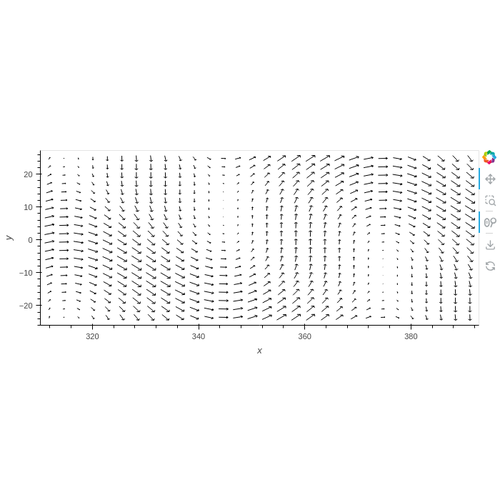
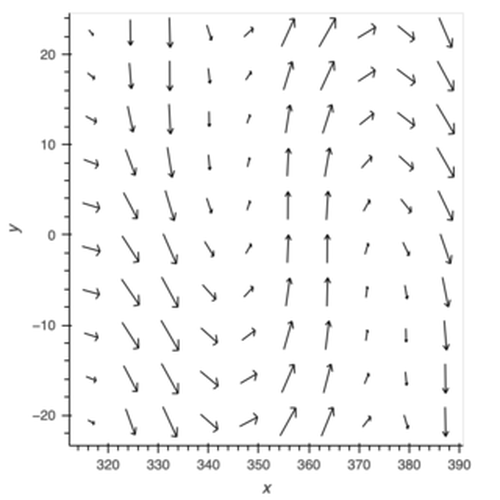
Vector Field

Vector Field

Vector Field

Big Data#

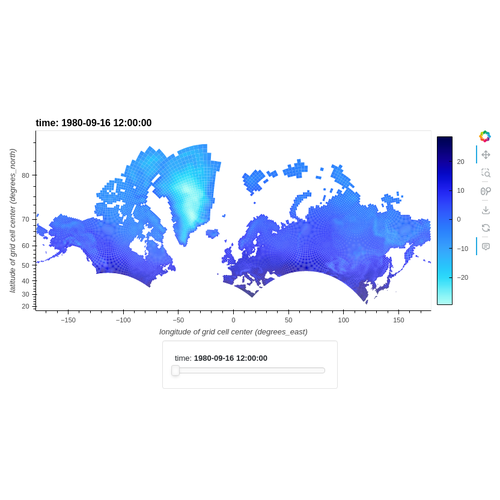
Large Vector Fields Dynamically Downsampled

Large Vector Fields Dynamically Downsampled

Large Vector Fields Dynamically Downsampled

Interactivity#
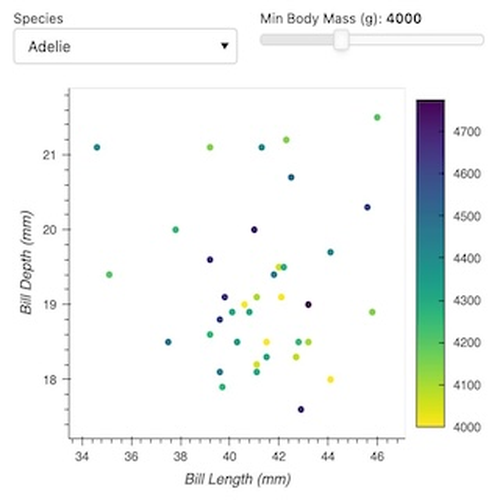
Interactive Panel App with `bind`

Interactive Panel App with bind

Interactive Panel App with bind
Interactive Panel App with `rx`

Interactive Panel App with rx

Interactive Panel App with rx
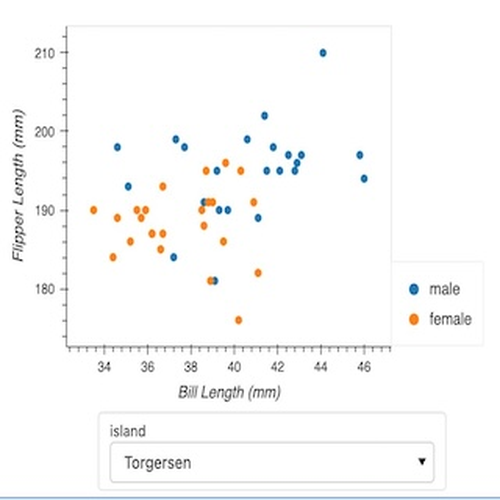
Groupby with Widget

Groupby with Widget

Groupby with Widget

Annotations#

Horizontal Bar Chart with Labels

Horizontal Bar Chart with Labels

Horizontal Bar Chart with Labels

previous

How to Use hvPlot with an AI Assistant

next

Basic Charts

On this page
  • API Reference
  • Basic Charts
  • Categorical
  • Multidimensional
  • Statistical
  • Time Series
  • Geospatial
  • Gridded
  • Big Data
  • Interactivity
  • Annotations
Edit on GitHub
Show Source

© Copyright 2016-2026 Holoviz contributors. Last updated on 2026-11-10.

Built with the PyData Sphinx Theme 0.16.1.