{
"cells": [
{
"cell_type": "markdown",
"metadata": {},
"source": [
"# Streaming"
]
},
{
"cell_type": "markdown",
"metadata": {},
"source": [
"hvPlot supports [streamz](https://github.com/mrocklin/streamz) DataFrame and Series objects, automatically generating streaming plots in a Jupyter notebook or deployed as a [Bokeh Server app](https://bokeh.pydata.org/en/latest/docs/user_guide/server.html). \n",
"\n",
"All hvPlot methods on streamz objects return HoloViews `DynamicMap` objects that update the plot whenever `streamz` triggers an event. For more information on `DynamicMap` and HoloViews dynamic plotting support, see the [HoloViews User Guide](https://holoviews.org/user_guide); here we will focus on using the simple, high-level hvPlot API rather than on the details of how events and data flow behind the scenes.\n",
"\n",
"**All plots generated by the streamz plotting interface dynamically stream data from Python into the web browser. The web version for this page includes *screen captures* of the streaming visualizations, not live streaming data.**\n",
"\n",
"As for any of the data backends, we start by patching the streamz library with the plotting API:"
]
},
{
"cell_type": "code",
"execution_count": null,
"metadata": {},
"outputs": [],
"source": [
"import hvplot.streamz # noqa"
]
},
{
"cell_type": "markdown",
"metadata": {},
"source": [
"## Basic plotting\n",
"\n",
"Throughout this section we will be using the ``Random`` object from streamz, which provides an easy way of generating a DataFrame of random streaming data but which could be substituted with any streamz ``DataFrame`` or ``Series`` driven by a live, external data source instead. To stop the ``Random`` stream you can call ``df.stop()`` at any point."
]
},
{
"cell_type": "code",
"execution_count": null,
"metadata": {},
"outputs": [],
"source": [
"from streamz.dataframe import Random\n",
"df = Random(interval='200ms', freq='50ms')"
]
},
{
"cell_type": "markdown",
"metadata": {},
"source": [
" "
]
},
{
"cell_type": "markdown",
"metadata": {},
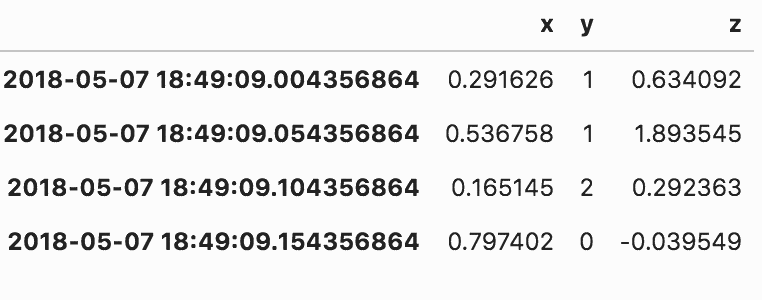
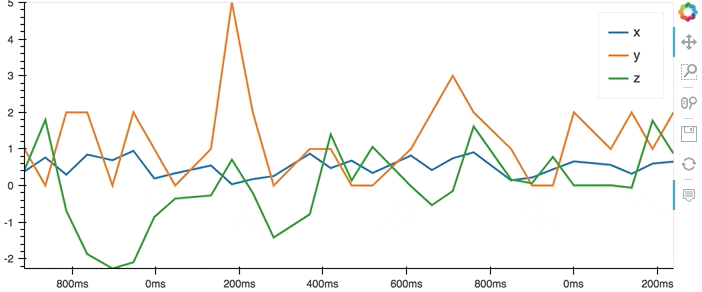
"source": [
"The plot method on Series and DataFrame is a simple wrapper around a\n",
"line plot, which will plot all columns:"
]
},
{
"cell_type": "code",
"execution_count": null,
"metadata": {},
"outputs": [],
"source": [
"df.hvplot()"
]
},
{
"cell_type": "markdown",
"metadata": {},
"source": [
"
"
]
},
{
"cell_type": "markdown",
"metadata": {},
"source": [
"The plot method on Series and DataFrame is a simple wrapper around a\n",
"line plot, which will plot all columns:"
]
},
{
"cell_type": "code",
"execution_count": null,
"metadata": {},
"outputs": [],
"source": [
"df.hvplot()"
]
},
{
"cell_type": "markdown",
"metadata": {},
"source": [
" "
]
},
{
"cell_type": "markdown",
"metadata": {},
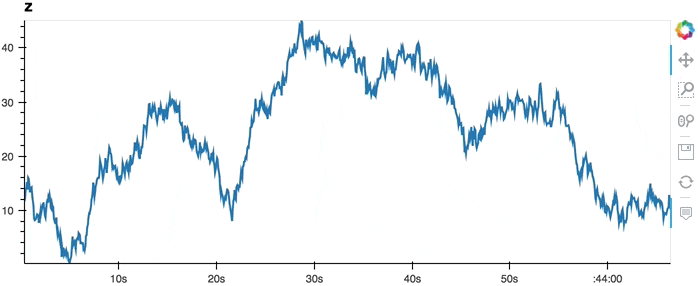
"source": [
"The plot method can also be called on a Series, plotting a specific column:"
]
},
{
"cell_type": "code",
"execution_count": null,
"metadata": {},
"outputs": [],
"source": [
"df.z.cumsum().hvplot()"
]
},
{
"cell_type": "markdown",
"metadata": {},
"source": [
"
"
]
},
{
"cell_type": "markdown",
"metadata": {},
"source": [
"The plot method can also be called on a Series, plotting a specific column:"
]
},
{
"cell_type": "code",
"execution_count": null,
"metadata": {},
"outputs": [],
"source": [
"df.z.cumsum().hvplot()"
]
},
{
"cell_type": "markdown",
"metadata": {},
"source": [
" \n",
"\n",
"Actually, *all* the functionality described in the [Plotting](Plotting.ipynb) user guide should work just the same as it does for a regular (non-streaming) dask or pandas DataFrame or Series, but will now update as new data appears.\n",
"\n",
"## Controlling the backlog\n",
"\n",
"The main difference when using a streaming DataFrame is that a only a certain amount of data will be buffered and displayed. The number of rows of data that will be buffered can be controlled by the ``backlog`` parameter. Here, let's buffer and display 10 rows of our streaming DataFrame as a table:"
]
},
{
"cell_type": "code",
"execution_count": null,
"metadata": {},
"outputs": [],
"source": [
"df.hvplot.table(width=400, backlog=10)"
]
},
{
"cell_type": "markdown",
"metadata": {},
"source": [
"
\n",
"\n",
"Actually, *all* the functionality described in the [Plotting](Plotting.ipynb) user guide should work just the same as it does for a regular (non-streaming) dask or pandas DataFrame or Series, but will now update as new data appears.\n",
"\n",
"## Controlling the backlog\n",
"\n",
"The main difference when using a streaming DataFrame is that a only a certain amount of data will be buffered and displayed. The number of rows of data that will be buffered can be controlled by the ``backlog`` parameter. Here, let's buffer and display 10 rows of our streaming DataFrame as a table:"
]
},
{
"cell_type": "code",
"execution_count": null,
"metadata": {},
"outputs": [],
"source": [
"df.hvplot.table(width=400, backlog=10)"
]
},
{
"cell_type": "markdown",
"metadata": {},
"source": [
" "
]
},
{
"cell_type": "markdown",
"metadata": {},
"source": [
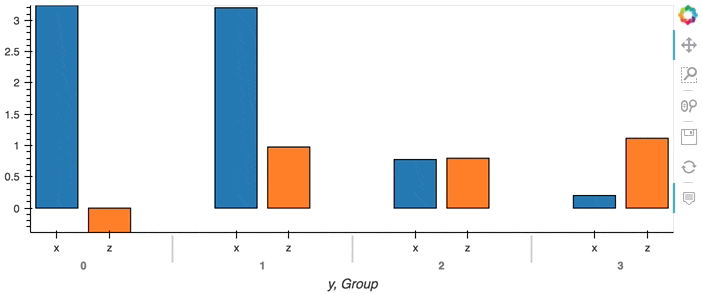
"This of course only has an effect when we are directly streaming data point by point. When we have an aggregate DataFrame, the plot will continuously accumulate updates:"
]
},
{
"cell_type": "code",
"execution_count": null,
"metadata": {},
"outputs": [],
"source": [
"df.groupby('y').sum().hvplot.bar(x='y')"
]
},
{
"cell_type": "markdown",
"metadata": {},
"source": [
"
"
]
},
{
"cell_type": "markdown",
"metadata": {},
"source": [
"This of course only has an effect when we are directly streaming data point by point. When we have an aggregate DataFrame, the plot will continuously accumulate updates:"
]
},
{
"cell_type": "code",
"execution_count": null,
"metadata": {},
"outputs": [],
"source": [
"df.groupby('y').sum().hvplot.bar(x='y')"
]
},
{
"cell_type": "markdown",
"metadata": {},
"source": [
" "
]
},
{
"cell_type": "markdown",
"metadata": {},
"source": [
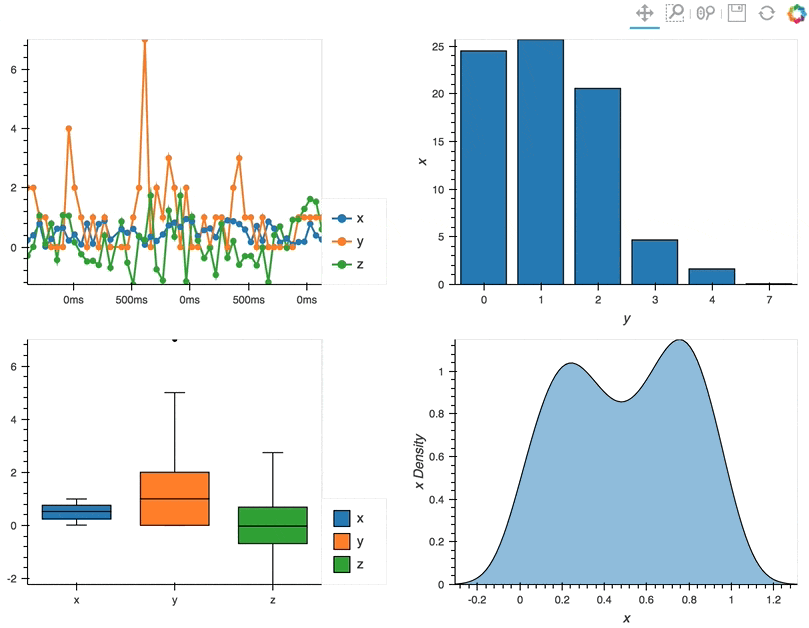
"## Composing Plots\n",
"\n",
"hvPlot is a convenient API for generating HoloViews objects. One of the core strengths of HoloViews objects is the ease with which they can be composed, which works with streaming plots just as with static ones. Individual plots can be composed using the ``*`` and ``+`` operators, which overlay and compose plots into layouts respectively. For more information on composing objects see the HoloViews [User Guide](https://holoviews.org/user_guide/Composing_Elements.html).\n",
"\n",
"By using these operators we can combine multiple plots into composite Overlay and Layout objects, and lay them out in two columns using the ``Layout.cols`` method:"
]
},
{
"cell_type": "code",
"execution_count": null,
"metadata": {},
"outputs": [],
"source": [
"(df.hvplot.line(width=400, backlog=100) * df.hvplot.scatter(width=400, backlog=100) +\n",
" df.groupby('y').sum().hvplot.bar('y', 'x', width=400) +\n",
" df.hvplot.box(width=400) + df.x.hvplot.kde(width=400, shared_axes=False)).cols(2)"
]
},
{
"cell_type": "markdown",
"metadata": {},
"source": [
"
"
]
},
{
"cell_type": "markdown",
"metadata": {},
"source": [
"## Composing Plots\n",
"\n",
"hvPlot is a convenient API for generating HoloViews objects. One of the core strengths of HoloViews objects is the ease with which they can be composed, which works with streaming plots just as with static ones. Individual plots can be composed using the ``*`` and ``+`` operators, which overlay and compose plots into layouts respectively. For more information on composing objects see the HoloViews [User Guide](https://holoviews.org/user_guide/Composing_Elements.html).\n",
"\n",
"By using these operators we can combine multiple plots into composite Overlay and Layout objects, and lay them out in two columns using the ``Layout.cols`` method:"
]
},
{
"cell_type": "code",
"execution_count": null,
"metadata": {},
"outputs": [],
"source": [
"(df.hvplot.line(width=400, backlog=100) * df.hvplot.scatter(width=400, backlog=100) +\n",
" df.groupby('y').sum().hvplot.bar('y', 'x', width=400) +\n",
" df.hvplot.box(width=400) + df.x.hvplot.kde(width=400, shared_axes=False)).cols(2)"
]
},
{
"cell_type": "markdown",
"metadata": {},
"source": [
" "
]
},
{
"cell_type": "markdown",
"metadata": {},
"source": [
"## Deployment as Bokeh apps\n",
"\n",
"HoloViews objects automatically render themselves in Jupyter notebook cells, but when deploying a bokeh app the plot has to be rendered explicitly. Deploying as a Bokeh Server app allows you to share live, dynamically updated visualizations like those for streaming data, backed by a running Python process.\n",
"\n",
"The following example describes how to set up a streaming DataFrame, declare some plots, compose them, set up a callback to update the plot and finally convert the composite plot to a bokeh Document, which can be served from a script using ``bokeh serve`` on the commandline.\n",
"\n",
"```python\n",
"\n",
"import numpy as np\n",
"import pandas as pd\n",
"import hvplot.streamz\n",
"import holoviews as hv\n",
"\n",
"from streamz import Stream\n",
"from streamz.dataframe import DataFrame\n",
"\n",
"renderer = hv.renderer('bokeh')\n",
"\n",
"# Set up streaming DataFrame\n",
"stream = Stream()\n",
"index = pd.DatetimeIndex([])\n",
"example = pd.DataFrame({'x': [], 'y': [], 'z': []},\n",
" columns=['x', 'y', 'z'], index=[])\n",
"df = DataFrame(stream, example=example)\n",
"cumulative = df.cumsum()[['x', 'z']]\n",
"\n",
"# Declare plots\n",
"line = cumulative.hvplot.line(width=400)\n",
"scatter = cumulative.hvplot.scatter(width=400)\n",
"bars = df.groupby('y').sum().hvplot.bar(width=400)\n",
"box = df.hvplot.box(width=400)\n",
"kde = df.x.hvplot.kde(width=400)\n",
"\n",
"# Compose plots\n",
"layout = (line * scatter + bars + box + kde).cols(2)\n",
"\n",
"# Set up callback with streaming data\n",
"def emit():\n",
" now = pd.datetime.now()\n",
" delta = np.timedelta64(500, 'ms')\n",
" index = pd.date_range(np.datetime64(now)-delta, now, freq='100ms')\n",
" df = pd.DataFrame({'x': np.random.randn(len(index)),\n",
" 'y': np.random.randint(0, 10, len(index)),\n",
" 'z': np.random.randn(len(index))},\n",
" columns=['x', 'y', 'z'], index=index)\n",
" stream.emit(df)\n",
"\n",
"# Render layout to bokeh server Document and attach callback\n",
"doc = renderer.server_doc(layout)\n",
"doc.title = 'Streamz HoloViews based Plotting API Bokeh App Demo'\n",
"doc.add_periodic_callback(emit, 500)\n",
"```\n",
"\n",
"For more details on deploying Bokeh apps see the HoloViews [User Guide](https://holoviews.org/user_guide/Deploying_Bokeh_Apps.html).\n",
"\n",
"## Using HoloViews directly\n",
"\n",
"HoloViews itself includes first class support for streamz DataFrame and Series; for more details see the [Streaming Data section](https://holoviews.org/user_guide/Streaming_Data.html) in the HoloViews documentation."
]
}
],
"metadata": {
"language_info": {
"name": "python",
"pygments_lexer": "ipython3"
}
},
"nbformat": 4,
"nbformat_minor": 4
}
"
]
},
{
"cell_type": "markdown",
"metadata": {},
"source": [
"## Deployment as Bokeh apps\n",
"\n",
"HoloViews objects automatically render themselves in Jupyter notebook cells, but when deploying a bokeh app the plot has to be rendered explicitly. Deploying as a Bokeh Server app allows you to share live, dynamically updated visualizations like those for streaming data, backed by a running Python process.\n",
"\n",
"The following example describes how to set up a streaming DataFrame, declare some plots, compose them, set up a callback to update the plot and finally convert the composite plot to a bokeh Document, which can be served from a script using ``bokeh serve`` on the commandline.\n",
"\n",
"```python\n",
"\n",
"import numpy as np\n",
"import pandas as pd\n",
"import hvplot.streamz\n",
"import holoviews as hv\n",
"\n",
"from streamz import Stream\n",
"from streamz.dataframe import DataFrame\n",
"\n",
"renderer = hv.renderer('bokeh')\n",
"\n",
"# Set up streaming DataFrame\n",
"stream = Stream()\n",
"index = pd.DatetimeIndex([])\n",
"example = pd.DataFrame({'x': [], 'y': [], 'z': []},\n",
" columns=['x', 'y', 'z'], index=[])\n",
"df = DataFrame(stream, example=example)\n",
"cumulative = df.cumsum()[['x', 'z']]\n",
"\n",
"# Declare plots\n",
"line = cumulative.hvplot.line(width=400)\n",
"scatter = cumulative.hvplot.scatter(width=400)\n",
"bars = df.groupby('y').sum().hvplot.bar(width=400)\n",
"box = df.hvplot.box(width=400)\n",
"kde = df.x.hvplot.kde(width=400)\n",
"\n",
"# Compose plots\n",
"layout = (line * scatter + bars + box + kde).cols(2)\n",
"\n",
"# Set up callback with streaming data\n",
"def emit():\n",
" now = pd.datetime.now()\n",
" delta = np.timedelta64(500, 'ms')\n",
" index = pd.date_range(np.datetime64(now)-delta, now, freq='100ms')\n",
" df = pd.DataFrame({'x': np.random.randn(len(index)),\n",
" 'y': np.random.randint(0, 10, len(index)),\n",
" 'z': np.random.randn(len(index))},\n",
" columns=['x', 'y', 'z'], index=index)\n",
" stream.emit(df)\n",
"\n",
"# Render layout to bokeh server Document and attach callback\n",
"doc = renderer.server_doc(layout)\n",
"doc.title = 'Streamz HoloViews based Plotting API Bokeh App Demo'\n",
"doc.add_periodic_callback(emit, 500)\n",
"```\n",
"\n",
"For more details on deploying Bokeh apps see the HoloViews [User Guide](https://holoviews.org/user_guide/Deploying_Bokeh_Apps.html).\n",
"\n",
"## Using HoloViews directly\n",
"\n",
"HoloViews itself includes first class support for streamz DataFrame and Series; for more details see the [Streaming Data section](https://holoviews.org/user_guide/Streaming_Data.html) in the HoloViews documentation."
]
}
],
"metadata": {
"language_info": {
"name": "python",
"pygments_lexer": "ipython3"
}
},
"nbformat": 4,
"nbformat_minor": 4
}